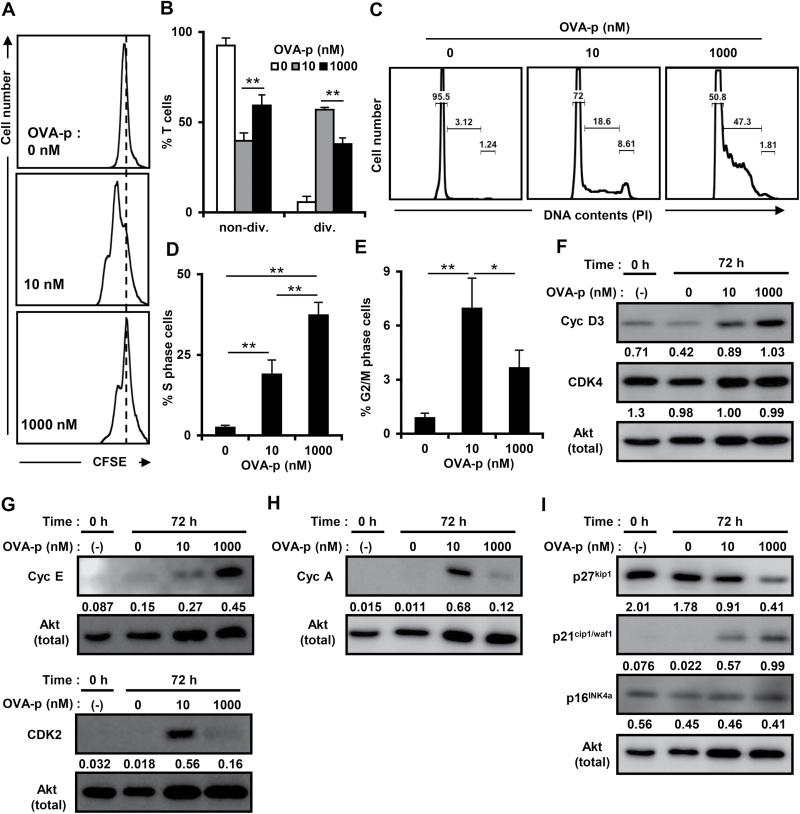
Fig. 4.
Cell cycle arrest is induced with a high dose of peptide. (A and B) Cells were labeled with CFSE and stimulated with each dose of peptide and T-cell-depleted splenocytes for 48h. Cells were analyzed by flow cytometry, gated on the PI−CD4+ population. The percentages of non-divided or divided T cells (B) are shown as the mean ± SD of more than three independent experiments. (C) The T-cell clone was cultured with BMDCs and stimulated with different doses of OVA-p (0, 10, 1000nM) for 72h. Cell cycle progression of viable cells was assessed by flow cytometry of PI-labeled cells, excluding the sub-G1 population. Results are representative of at least three independent experiments. (D and E) The T-cell clone was stimulated as in Fig. 4(D). The percentages of T cells in S phase (D) or G2/M phase (E) are shown as the mean ± SD of more than three independent experiments. *P < 0.05, **P < 0.01. (F–I) Cell lysates immunoblotted with cyclin D3, CDK4, cyclin E, CDK2, cyclin A, p16INK4a, p21cip1/waf1 and p27kip1 antibodies. The expression levels of each molecule are shown as the fold differences compared with the same control protein (Akt). Similar results were obtained in at least three independent experiments.

