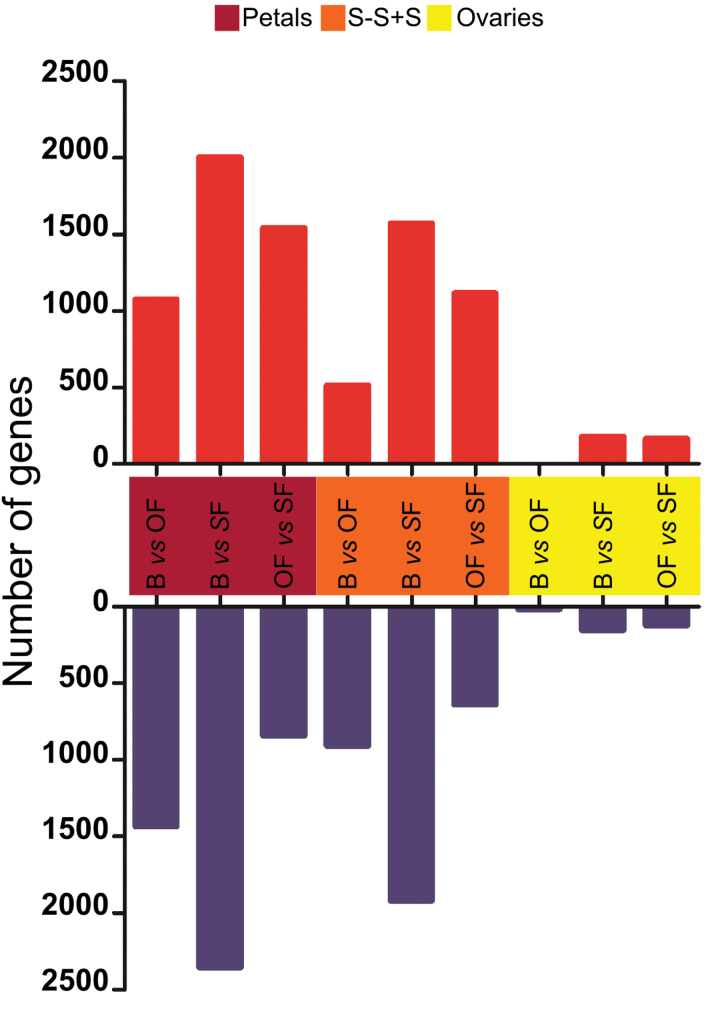
Fig. 2.
Number of genes differentially expressed in different floral tissues (petals, style-stima+stamen [S-S+S] and ovaries) during flower development. The comparisons were bud versus open flower (B vs OF), bud versus senescent flower (B vs SF), and opened flower versus senescent flower (OF vs SF). Red and blue indicate upregulation and downregulation, respectively.

