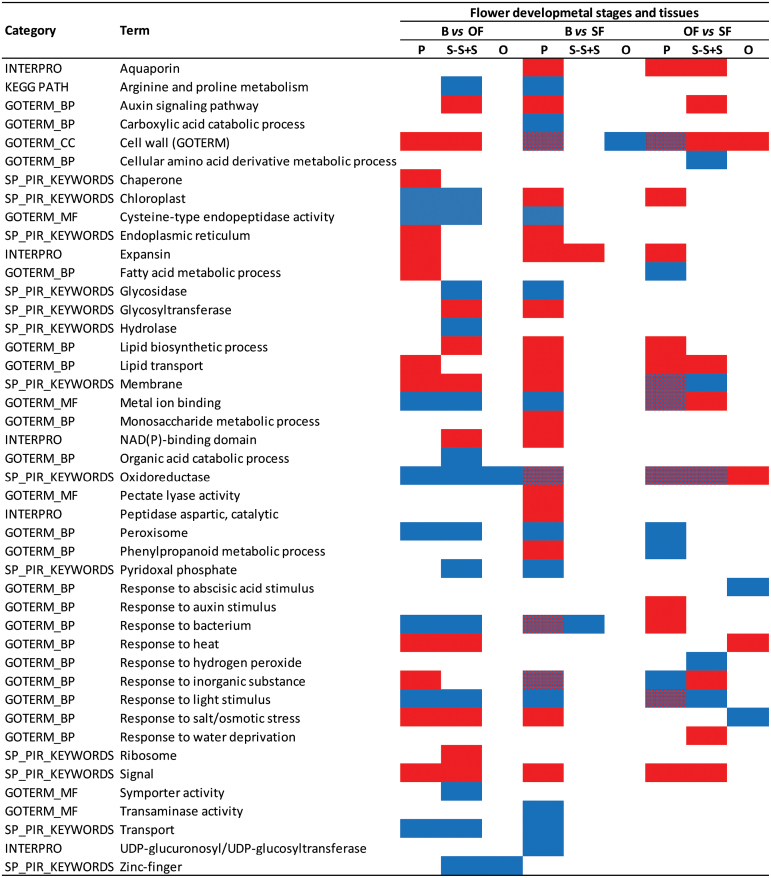
Fig. 3.
Over-representation analysis of gene terms upregulated and/or downregulated by more than 2-fold between flower developmental stages (bud versus opened flowers, B vs OF; buds versus senescent flowers, B vs SF; opened flowers versus senescent flowers, OF vs SF) and tissues (petal, P; style-stigma+stamens, S-S+S; ovary, O) according to functional categories (DAVID). Selected significantly enriched functional annotation clusters are shown together with the term(s) most representative of each cluster. Only those term(s) showing a cluster enrichment scores >1.3, a significant P ≤ 0.05 after correction for multiple testing by the Benjamini-Hochberg method, and a count ≥10 are shown. Red, blue, and overlap red/blue, represent enriched terms in the upregulated, downregulated, and both up- and downregulated gene sets, respectively.

