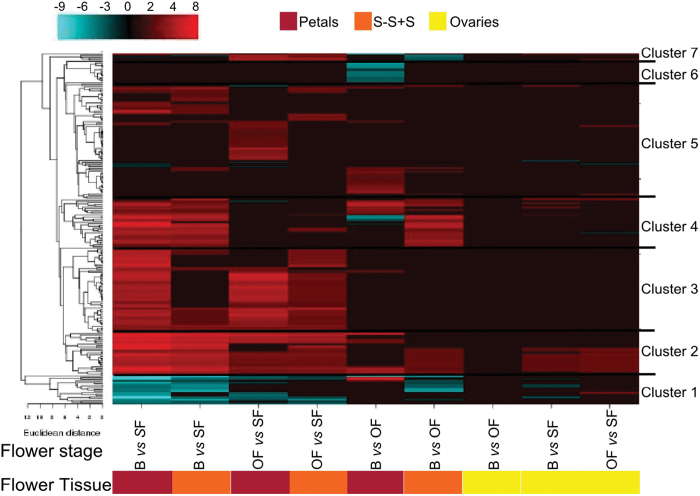
Fig. 6.
Transcript abundance changes and cluster analysis of the cell wall-modifying gene set that was differentially expressed among flower tissues and stages. The cluster analysis for each group of genes was performed using hierarchical clustering with average linkage and Euclidian distance measurement. Rows represent differentially expressed genes, and columns represent the tissue and developmental stages of flowers considered. The log-2 ratio values of significantly regulated transcripts were used for hierarchical clustering analysis. The transcript ID and annotation of each gene are listed in Supplementary Table S13, and the cluster numbers are listed on the left. Red and blue indicate upregulation and downregulation, respectively.

