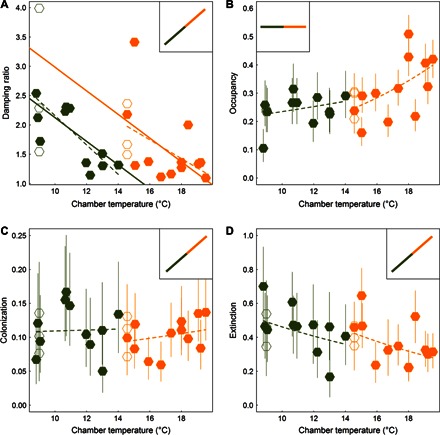
Fig. 3. Stability and demographic responses of ant communities to warming.

(A) Damping ratio, (B) occupancy, (C) colonization, and (D) extinction as functions of MAT (°C) for ant communities inhabiting nest boxes at Duke Forest (orange) and Harvard Forest (green); chambered plots are represented by filled symbols, and chamberless control plots are represented by open symbols. For the damping ratio, dashed lines represent simple linear regressions; the solid lines are from an analysis of covariance (ANCOVA) with separate intercepts for site and a common slope for MAT (Table 1). For occupancy, colonization, and extinction, mean proportions and binomial 95% confidence intervals are presented; dashed lines are predicted values from quasi-binomial GLMs (Table 1). Inset panels depict the null expectations for stability, occupancy, colonization, and extinction under a simple model of increasing activity of thermophilic ectotherms at higher temperatures.
