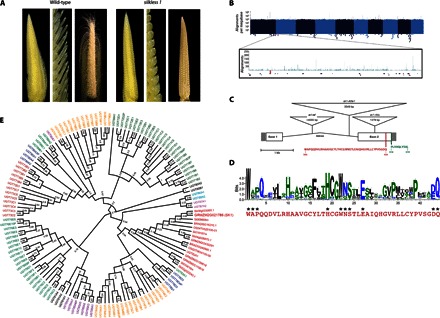
Fig. 1. sk1 encodes a family 1 UGT.

(A) Comparison of wild-type ears (Sk1/sk1-ref; left panels) and sk1 mutant ears (sk1-ref/sk1-ref; right panels). Left panels show respective ears at 2.5 cm in length, middle panels provide higher magnification to resolve individual spikelets, and right panels show ears at 8 cm. (B) Manhattan plot showing the depth of TaqαI read coverage (blue vertical lines) by chromosome position. Each x-axis pixel represents a bin of 1 Mb, and the logarithmic y axis denotes the number of reads mapping to each bin. The sk1 genetic region (see fig. S1) is shown enlarged with the TaqαI read coverage (blue), Mu junction fragments (red triangles), and location of predicted and known genes. (C) Structure of the sk1 gene, mutant alleles, and protein motifs. Filled boxes at the left and right sides indicate the 5′ and 3′ untranslated regions, respectively. Open boxes indicate coding regions, and angled lines indicate the single-intron position. Insertions found in three sk1 mutant alleles are represented by inverted triangles positioned at the corresponding insertion site (see table S1). The UGT signature/PSPG box is shown in red. The C-terminal 10 amino acids contain a PTS1-like domain shown in green. (D) WebLogo displaying the weighted alignment of the PSPG box of 107 identified Arabidopsis UGTs using ClustalW alignment. Conserved residues implicated in UDP-sugar binding are indicated with asterisks. The PSPG box of SK1 is shown in red below the WebLogo. (E) Maximum likelihood tree of SK1 homologs and the Arabidopsis UGT family. SK1 and its homologs cluster with the UGT Group N protein UGT82A1. Group N UGTs are indicated in red, and bootstrapping confidence values are shown at nodes.
