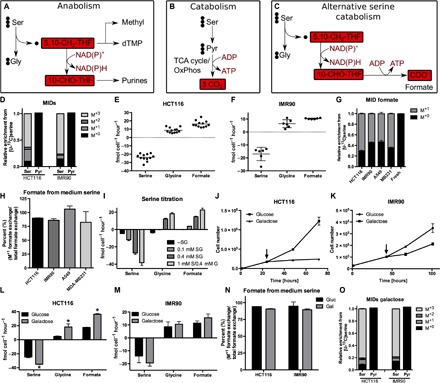
Fig. 1. Serine catabolism is induced upon energy stress.

(A) Current model of serine metabolism to support purine synthesis. dTMP, deoxythymidine monophosphate. (B) Current model of serine catabolism. (C) Postulated model of serine one-carbon catabolism with formate overflow. OxPhos, oxidative phosphorylation. (D) MIDs of pyruvate and serine using [U-13C]serine as a tracer in HCT116 colorectal cancer cells and IMR90 human fibroblasts. (E and F) Absolute exchange rates of serine, glycine, and formate in (E) HCT116 and (F) IMR90 cells. Positive values indicate metabolite release and negative value uptake from cells. Each dot indicates an independent experiment (performed with three cultures per condition). (G) MID of extracellular formate using [U-13C]serine as a tracer in HCT116, IMR90, A549, and MDA-MB231 cells. (H) Percentage of formate from medium serine. (I) Serine, glycine, and formate exchange rates at different medium serine concentrations in HCT116 cells (as indicated). S, serine; G, glycine. (J and K) Proliferation of (J) HCT116 and (K) IMR90 cells upon galactose. The arrow indicates start of galactose treatment. (L and M) Absolute exchange rates of serine, glycine, and formate in (L) HCT116 and (M) IMR90 cells upon galactose. (N) Percentage of formate from medium serine in HCT116 and IMR90 cells upon glucose and galactose. (O) MIDs of pyruvate and serine using [U-13C]serine as a tracer in HCT116 and IMR90 cells in galactose medium. Data are presented as means ± SD (n = 3 cultures representative of at least two independent experiments), except for (E) and (F) (see above). *P < 0.05 by Welch’s t test.
