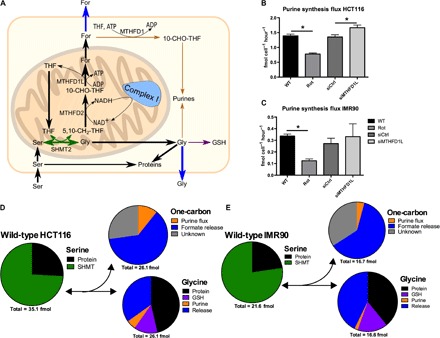
Fig. 3. Formate efflux exceeds anabolic one-carbon demands.

(A) Model summarizing major cellular serine–derived fluxes in mammalian cells. (B and C) Absolute purine synthesis flux in (B) HCT116 and (C) IMR90 cells. (D and E) Pie charts representing fluxes of serine, glycine, and one-carbon moieties in (D) HCT116 and (E) IMR90 cells under normal conditions. The numbers underneath the pie chart represent the summed contribution of all sinks reported in the pie chart above (per cell per hour). We note that these pie charts just reflect the average measurements [see (B) and (C) and fig. S3 (A to D) for the measurement errors of each specific contribution]. SHMT, serine hydroxymethyltransferase. Data are presented as means ± SD (n = 3 cultures representative of at least two independent experiments). *P < 0.05 by Welch’s t test.
