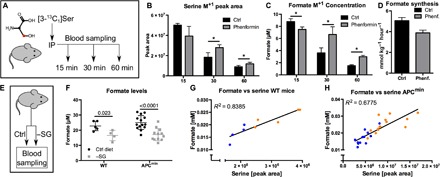
Fig. 4. Serum formate depends on serine catabolism in vivo.

(A) Model illustrating the setup to trace serine-derived formate formation in vivo. (B) Abundance of serine M+1 isotopologues in plasma, 15, 30, and 60 min after injection with or without phenformin. (C) Concentration of formate M+1 isotopologue in plasma, 15, 30, and 60 min after injection with or without phenformin. (D) Estimated serine-derived formate synthesis rate in phenformin-treated or phenformin-untreated mice (see text for reported CIs). (E) Model illustrating the experimental setup for serine/glycine (−SG) starvation, to measure its effect on serum formate level. (F) Formate concentration in the serum of serine- and glycine-starved mice [3 weeks starvation in WT mice (n ≥ 5) and in APCmin mice at clinical end point (n ≥ 12)]. We note the exclusion of one outlier in the 3-week setup (see fig. S4, D and E). (G and H) Correlation between serine and formate levels in (G) WT and in (E) APCmin mice in respect to serine/glycine starvation. Data are presented as means ± SD [(B to D) n = 4 mice per condition and time point]. *P < 0.05 by Welch’s t test.
