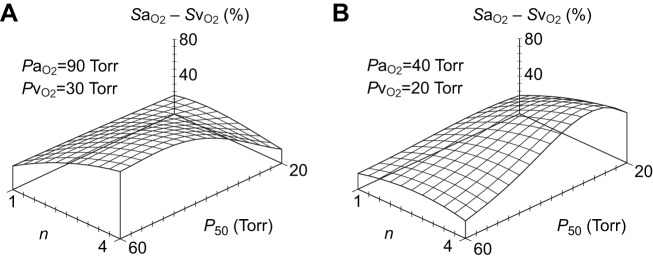
Fig. 3.
Blood P50 and Hill's cooperativity coefficient, n, influence blood O2 transport (indexed by the difference in arterial and venous O2 saturation). (A) Normoxia; (B) hypoxia. In these three-dimensional plots, the difference in arterial and venous O2 saturation (SaO2−SvO2) is indicated by the height of the projection above the reference plane. The higher the projection, the greater the difference in O2 saturation.

