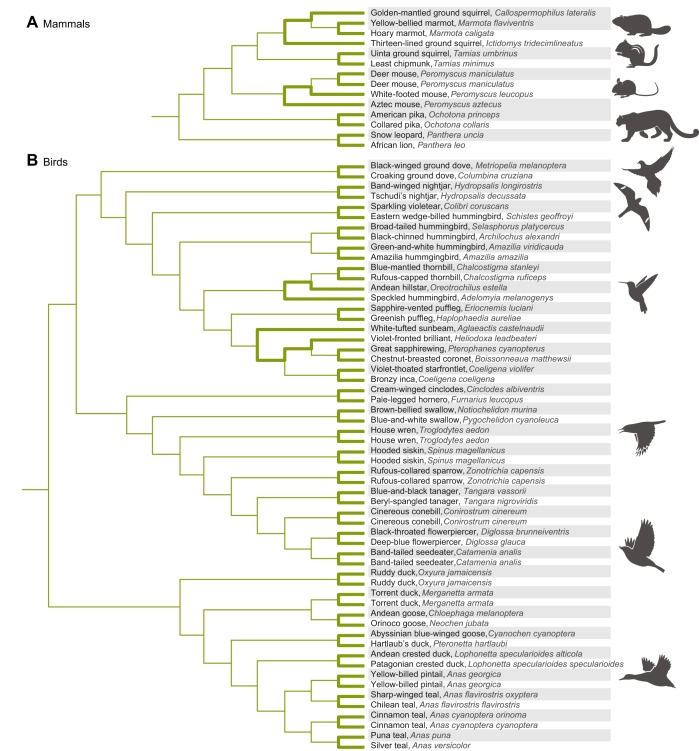
Fig. 5.
Phylogenetic relationships of 14 mammalian taxa and 58 avian taxa used in comparative analyses of Hb function. Rows corresponding to high-altitude taxa are shaded. (A) In the mammalian phylogeny, branches in bold connect pairs of high- and low-altitude taxa that were used to test for a relationship between Hb–O2 affinity and native elevation. As there are no overlaps in the paths of descent connecting each designated pair of high- and low-altitude taxa, the seven pairwise comparisons are statistically independent. For information regarding elevational ranges, see Storz et al. (2009, 2010a), Revsbech et al. (2013), Janecka et al. (2015), Natarajan et al. (2015a) and Tufts et al. (2015). (B) In the avian phylogeny, branches in bold connect pairs of high- and low-altitude taxa that were used to test for a relationship between Hb–O2 affinity and native elevation. As in the case with the mammals, the 29 pairwise comparisons are phylogenetically independent. For information regarding elevational ranges, see Projecto-Garcia et al. (2013), Cheviron et al. (2014), Galen et al. (2015) and Natarajan et al. (2015b, 2016).

