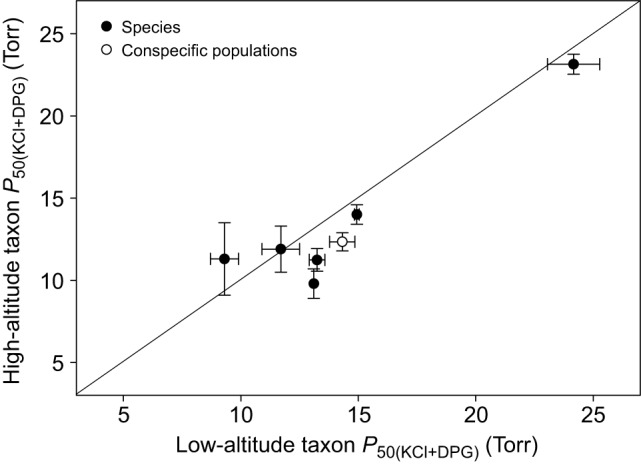
Fig. 7.

There is no evidence for a significant elevational trend in the Hb–O2 affinities of mammals. The plot shows measures of Hb–O2 affinity in the presence of anionic effectors [P50(KCl+IHP) (±s.e.m.)] for seven matched pairs of high- and low-altitude taxa. Data points that fall below the diagonal (x=y) denote cases in which the high-altitude member of a given taxon pair possesses a higher Hb–O2 affinity (lower P50). The paired-lineage design ensures that all data points are statistically independent (see text for details). Filled symbols denote comparisons between species, whereas the open symbol denotes a comparison between high- versus low-altitude populations of the same species (P. maniculatus).
