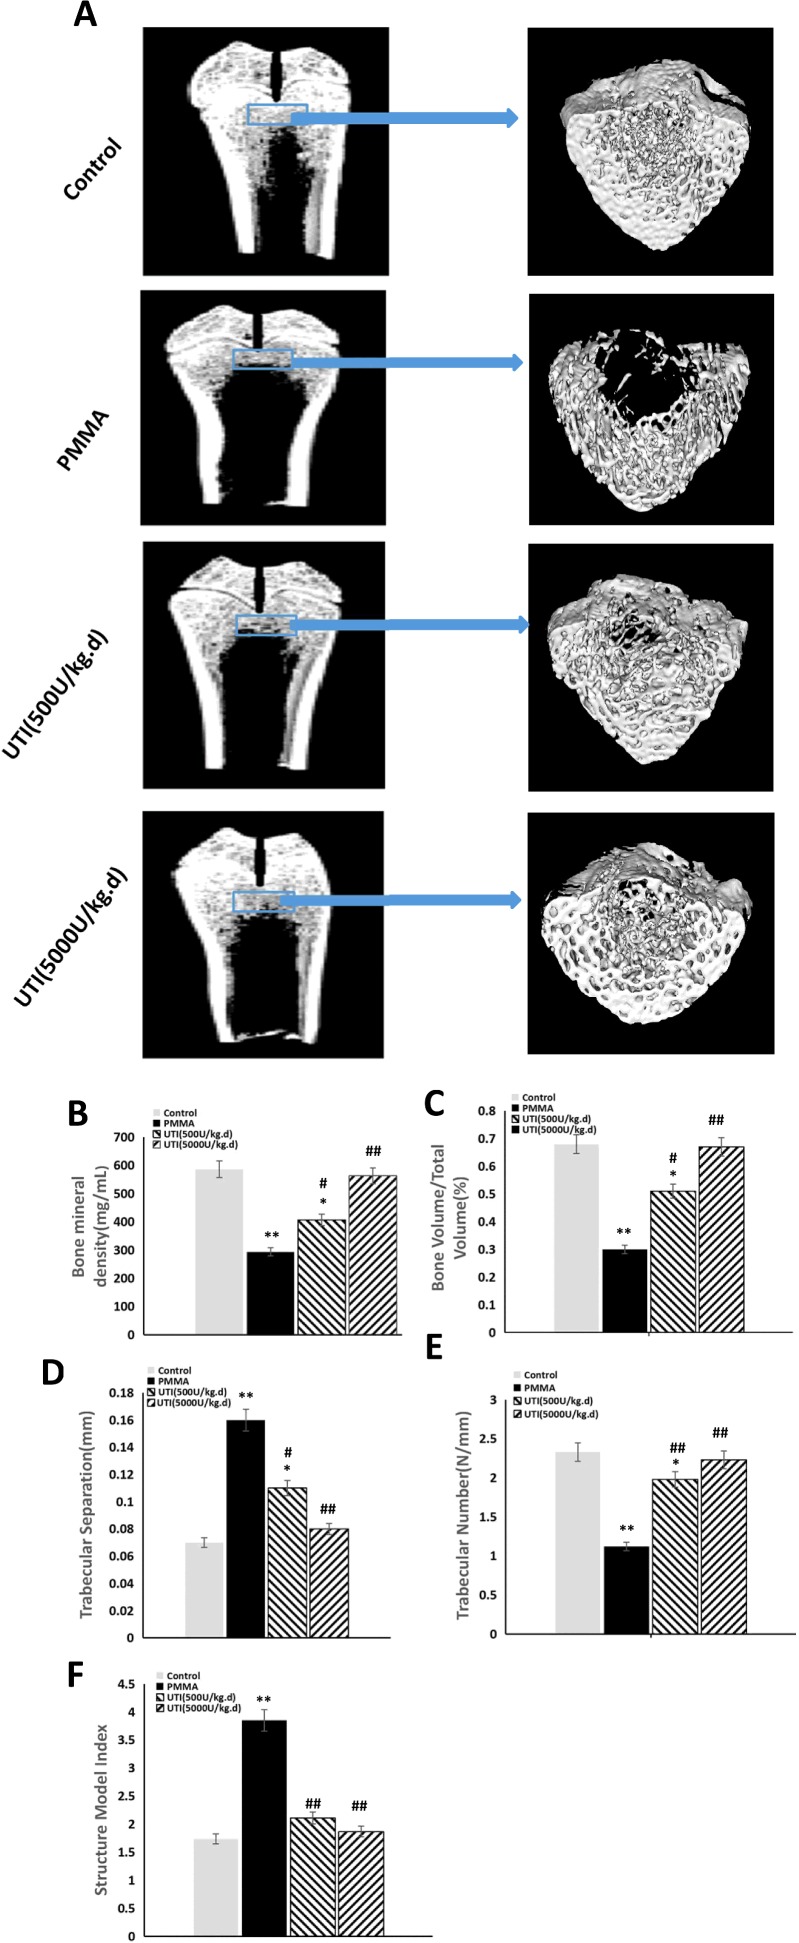
Figure 7. UTI inhibited the bone osteolysis in PMMA-induced murine osteolysis model.
The animal models were treated with or without various concentration of UTI (500 or 5000 units/kg i.p.) for 3 h prior to PMMA with adherent LPS implantation, followed by UTI (500 or 5000 units/kg) being injected (i.p.) once per day for 21 days. (A) Representative coronal section views of distal femur using micro-CT from each group (left) and the reconstructed images with 3D (right). The reconstructed sites are indicated by blue bar frames (left) and the bone osteolysis sites are indicated by white arrows (right). (B) BMD (mg/ml), (C) BV/TV (%), (D) Tb.Sp. (mm), (E) Tb.N. (N/mm) and (F) SMI of each sample were measured. All values are expressed as mean ± S.E.M. n=10 mice per group. *, P<0.05 and **, P<0.01 compared with control; #, P<0.05 and ##, P<0.01 compared with PMMA group.

