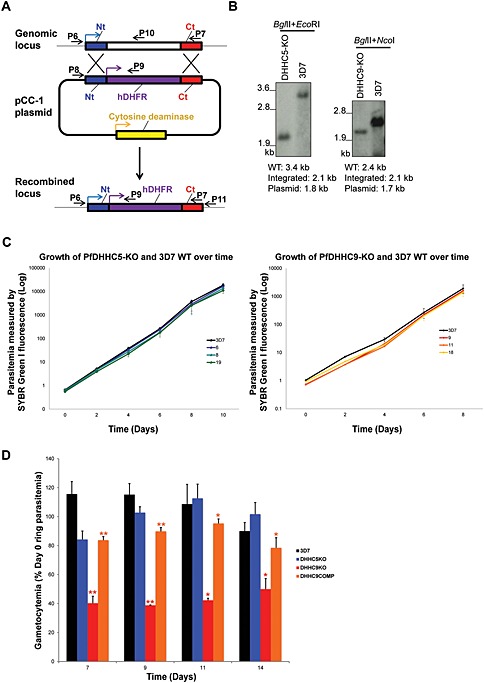
Figure 7.

Generation of PfDHHC knock‐out transgenic lines in Plasmodium falciparum. A. Scheme of the strategy used to knock‐out the endogenous locus of the PfDHHC genes of interest. The primer positions illustrated here indicate the primers used for genotyping of the PfDHHC knock‐out transgenic lines. Genotyping PCR for PfDHHC5 and 9 knock‐out lines is shown in the supplementary material (Figure S2B). B. Southern blot confirming the disruption of PfDHHC5 and 9 knock‐out transgenic lines, using probes, which hybridized to the N‐terminal region of each gene. The restriction enzymes are used for digestion, and the expected sizes for the wild‐type, episomal and integrated locus are as indicated. (C) Growth assay comparing the growth of PfHHC5‐KO and PfDHHC9‐KO with wild‐type 3D7. Parasitemia of PfDHHC5‐KO clones (6, 8 and 19) (left) and PfDHHC9‐KO clones (9, 11 and 18) (right) along with wild‐type 3D7 measured every 2 days for a total of 8 or 10 days using flow cytometry. D. Gametocyte production in PfDHHC5KO, PfDHHC9KO and PfDHHC9COMP lines. Gametocytogenesis was induced in PfDHHC5 and 9 knock‐out parasites, as well as in PfDHHC9COMP parasites and wild‐type 3D7 by seeding cultures at 1% ring parasitemia (Day 0) and changing culture media daily for 14 days. The ring parasitemia on Day 2 was counted, and asexual growth was found to be similar across all lines (data not shown), as expected from the growth curves in (C). Percentage (%) gametocytemia was obtained by counting the number of gametocytes present in approximately 2000 erythrocytes on Day 7, 9, 11 and 14 after induction. The % gametocytemia was normalized to the 1% starting ring parasitemia on the day of induction (Day 0). The data are the result of three replicates ± standard error of the mean.  P ≤ 0.05,
  P ≤ 0.01 (unpaired t‐test, comparison between DHHC9KO and 3D7).
  P ≤ 0.05,
  P ≤ 0.01 (unpaired t‐test, comparison between DHHC9KO and DHHC9COMP). Average gametocytemias along with the standard error of mean for each parasite line on each day is shown in Table S6.
