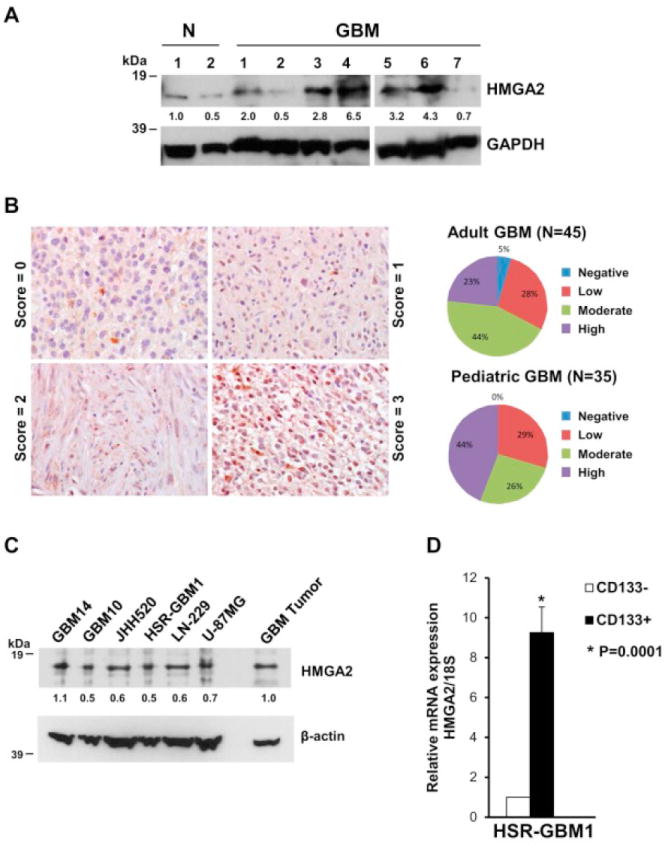
Figure 1.

The majority of GBM primary tumors and cell lines show increased expression of HMGA2. (A) Western blot showing increased expression of HMGA2 protein in 71% (5/7) primary tumor samples from GBM patients compared to normal (N) brain tissue (cortex). GAPDH was used as a loading control. HMGA2 and GAPDH protein levels were quantitated using densitometry. Values normalized to sample#1 of normal brain tissue (N) are depicted below the blots. (B) Immunohistochemical analysis showing varying expression of HMGA2 in primary GBM samples on a tissue microarray (Scores: 0 or negative =no staining, 1=low staining, 2=moderate staining, 3=high staining). Quantitation of the percentage of tumor samples showing the staining is depicted at right. (C) Western blot showing HMGA2 expression in GBM cell lines (GBM14, GBM10, JHH520, HSR-GBM1, LN-229 and U-87 MG). A primary tumor sample is also shown for comparison of HMGA2 expression. β-actin was used as a loading control. HMGA2 and β-actin protein levels were quantitated on the western blot using densitometry and values normalized to the primary tumor sample for each cell line are depicted below the blots. (D) Increased expression of HMGA2 mRNA by quantitative PCR in CD133+ HSR-GBM1 neurospheres compared to CD133- cells. Data were normalized to 18S ribosomal RNA and are shown as relative expression (relative to CD133- cells) (*P=0.0001 by Student’s t-test, N=2).
