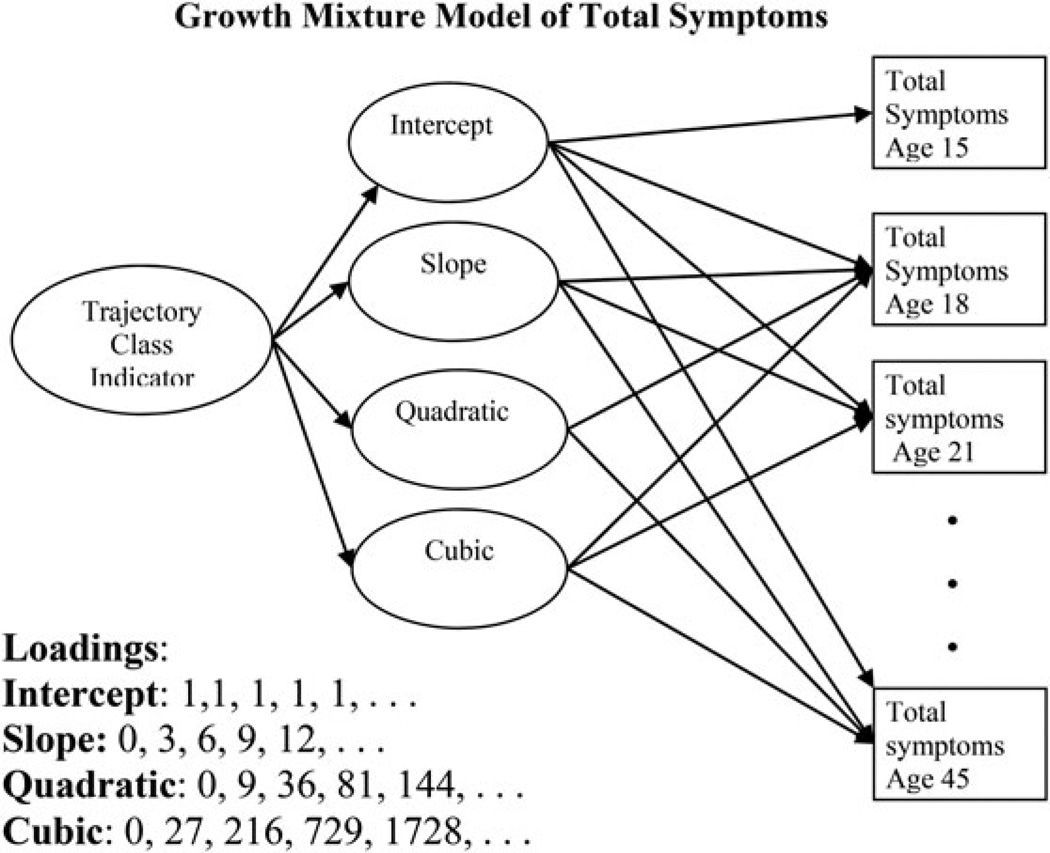
Figure 1.
Growth mixture model of symptoms of alcoholism. The continuous latent variables defining growth parameters are indicated by total symptoms of alcoholism at 3-year intervals from age 15 to age 45. The loadings are indicated in the bottom of the figure and create intercept, slope, quadratic, and cubic growth parameters. The four growth parameters are indicators for the latent categorical variable “trajectory class indicator.” To avoid figure clutter, indicators of total symptoms between ages 21 and 45 have been omitted.

