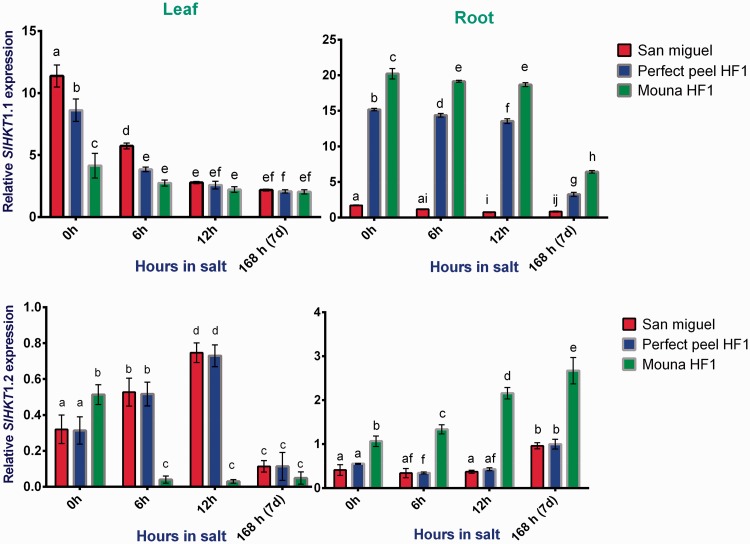
Figure 10.
Relative gene expression of tomato HKT1;1 and HKT1;2 in response to salt stress in leaves and roots San Miguel, Perfect peel HF1 and Mouna HF1 genotypes. Total RNA was purified from tissues of tomato plants treated with 150 mM NaCl for 0 h, 6 h, 12 h and 7 days. Transcript level was analyzed by qRT-PCR using primers indicated in Table 1. Tomato Actin gene was used as reference gene. Error bars show the standard error between three replicates performed. Bars with different letters within each panel are significantly different at P > 0.05 according to Tukey's test.

