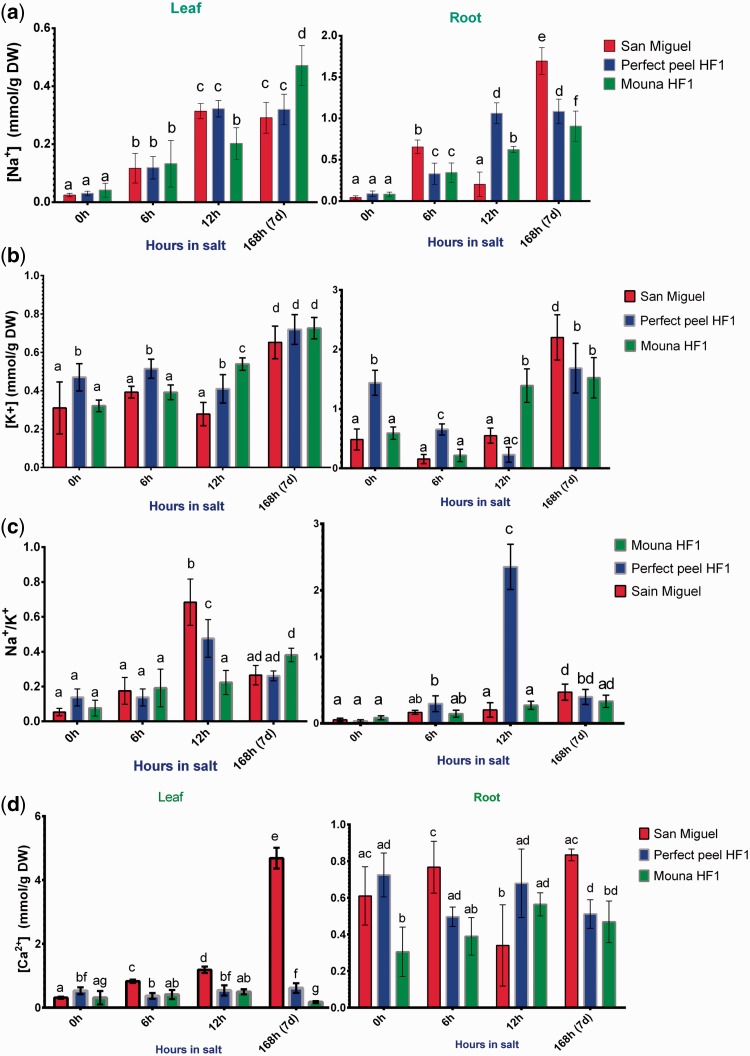
Figure 3.
Ion content in leaf and root tissues within San Miguel, Perfect peel HF1 and Mouna HF1 genotypes during 6 h, 12 h and 7 days post-NaCl treatment (15 dS/m, pH 7.5). (a) Na+, (b) K+, (c) Na+/K+ and (d) Ca2+. Values are expressed in mmole/g DW. The data reported are the mean ± SE of five biological replicas. Bars with different letters within each panel are significantly different at P > 0.05 according to Tukey's test.

