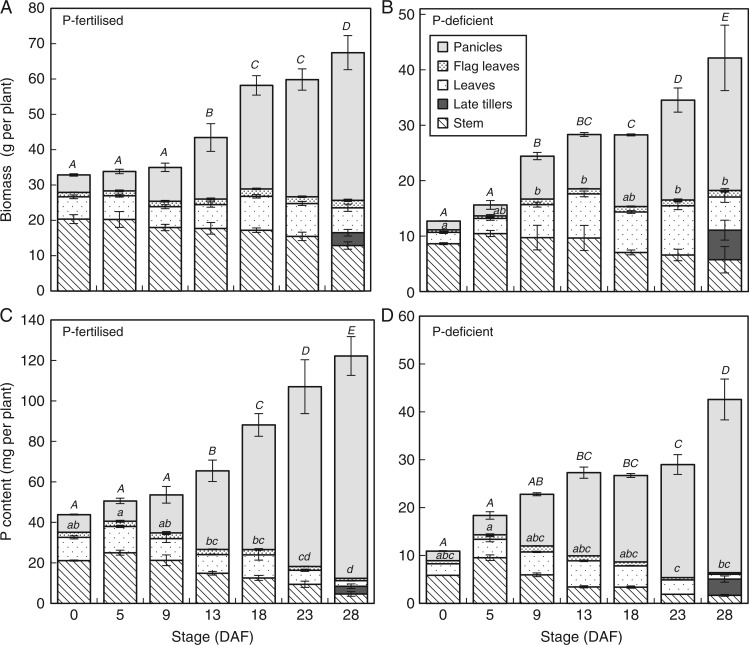
Fig. 1.
Above-ground biomass (A, B) and P content (C, D) in five different rice tissues of P-fertilized (A, C) and P-deficient (B, D) plants during grain filling of the field study. Error bars depict standard deviation of the mean of three replicates plants per time point. The letters present the results of Duncan’s multiple range tests (α = 0·05, n = 3) done for ‘Panicles’ (capital letters) and for the vegetative above-ground compartment (lowercase letters) using the stage (DAF) as factor. No letter indicates no significant difference between time points.

