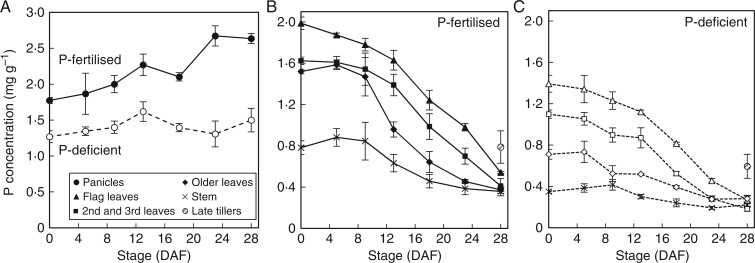
Fig. 2.
Average P concentration of rice panicles (A) and vegetative tissues (B, C) during grain filling in P-fertilized plants (closed symbols and solid lines) and P-deficient plants (open symbols and dotted lines) of the field experiment. Error bars depict standard error of the mean of three replicates plants per time point.

