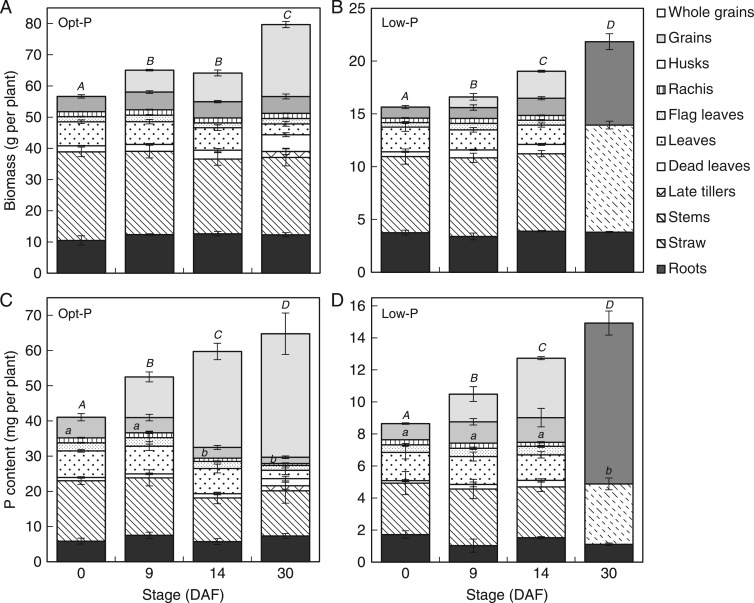
Fig. 3.
Average biomass (A, B) and P content (B, D) of rice tissues during grain filling in Opt-P (A, C) and Low-P (B, D) treatments of the hydroponic experiment. Error bars depict standard deviation of the mean of three and four replicates pots in Low-P and Opt-P, respectively. The letters present results of Duncan’s multiple range tests (α = 0·05, n = 3 for Low-P, n = 4 for Opt-P) done for ‘Whole grains’ (capital letters) and for the rest of the plant* (lowercase letters). No letter indicates no significant difference between time points. *Roots + all leaves + rachis.

