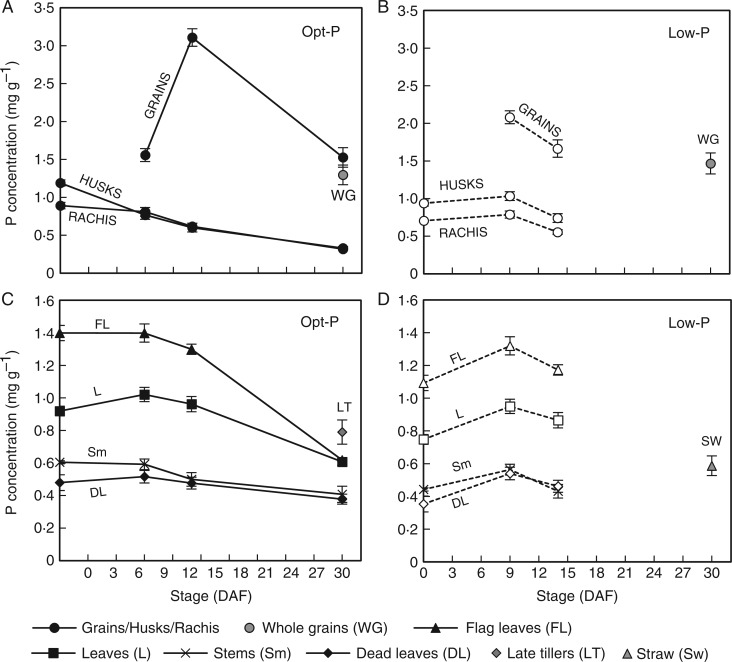
Fig. 4.
Average P concentrations of panicle tissues (A, B) and vegetative tissues (C, D) during grain filling in Opt-P (closed symbols and solid lines) and Low-P (open symbols and dotted lines) treatments of the hydroponic glasshouse experiment. Error bars depict standard deviation of the mean of three and four replicates pots in Low-P and Opt-P, respectively.

