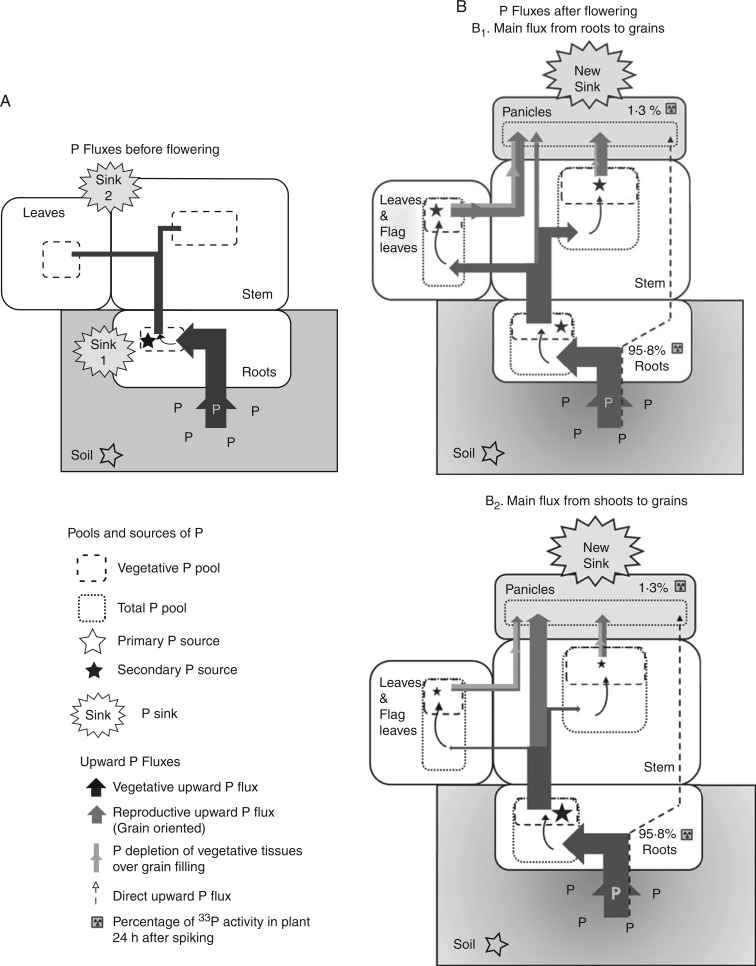
Fig. 7.
Proposed model of upward P fluxes in rice plants before (A) and after (B) flowering. Model variations B1 and B2 represent the two possible reproductive fluxes enabling P to be loaded into grains, that is either using roots (B1) or vegetative tissues (B2) as the main secondary P source. Size of arrows is proportional to the amount of P mobilized by fluxes from sowing to flowering (A) and during grain filling (B) measured in Opt-P treatment of the hydroponic study. Values in italic depict the percentage of 33P activity in plants 24 h after spiking in Opt-P.

