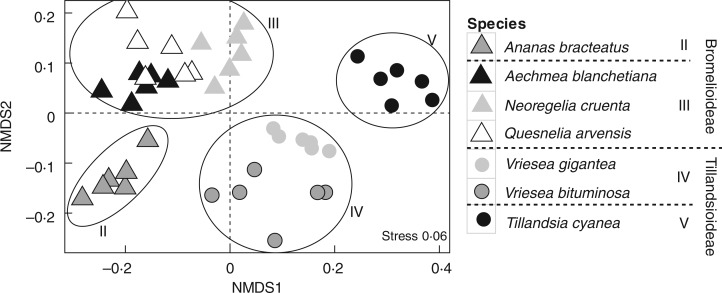
Fig. 5.
Non-metric multidimensional scaling (NMDS) plot derived from the total nitrogen incorporated, soluble protein and asparagine concentrations, relative growth rate and leaf mass per area of leaves of each bromeliad species after receiving Dendropsophus nanus faeces. Triangles indicate Bromelioideae and circles indicate the Tillandsioideae subfamily. Roman letters indicate the ecophysiological types of each bromeliad species (see the Materials and Methods for details).

