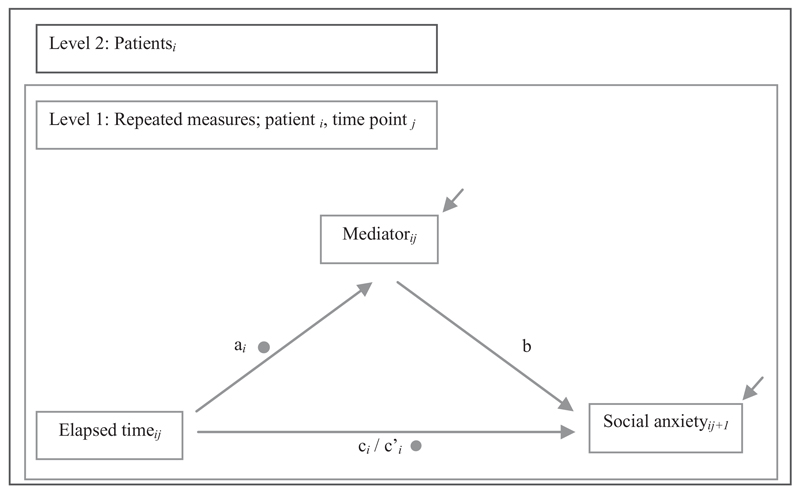
Figure 1.
Random effects multilevel mediation model as estimated for the present study. Subscripts indicate varying measures across patients i and time points j. Continuous arrows and path labels illustrate hypothesized causal effects. Filled circles adjacent to path labels represent random slopes. Path labels without filled circles represent fixed slopes. Raised arrows indicate residuals.

