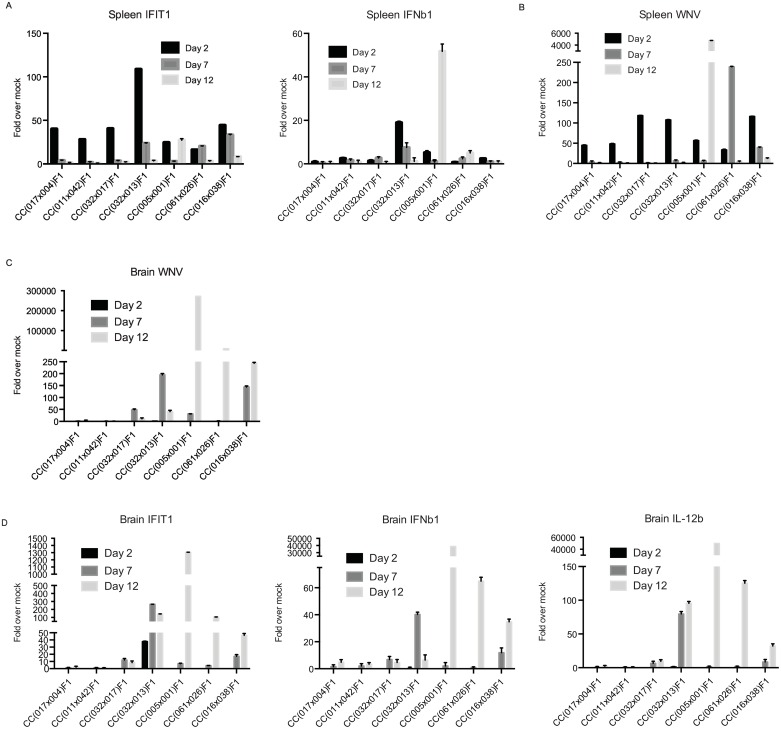
Fig 3. Differential innate immune signatures and viral load in the tissues.
Total RNA was isolated from spleens and brains from CC RIX mice infected with WNV for the indicated times. Plots show qPCR results for IFIT1 and IFN-ß expression (A) and WNV viral load in the spleen (B) and brain (C) as well as IFIT1, IFN-ß, and IL-12 expression in the brain (D) at innate time points, relative to mock values. Data represent 3 mice per group at d2, 7, and 12 time points in the discovery screen. Fig 3A & B, p<0.001 for all comparisons of CC(032x013)F1 to the other RIX lines at d2 (IFIT1 and IFN-ß); Fig 3C, p<0.01 for CC(032x013)F1 brain WNV load compared to the three non-disease lines at d7; Fig 3D, p<0.001 for all comparisons of CC(032x013)F1 to the other RIX lines at d2 (IFIT1); p<0.001 for all comparisons of CC(032x013)F1 to the other RIX lines at d7(IFN-ß and IL-12).

