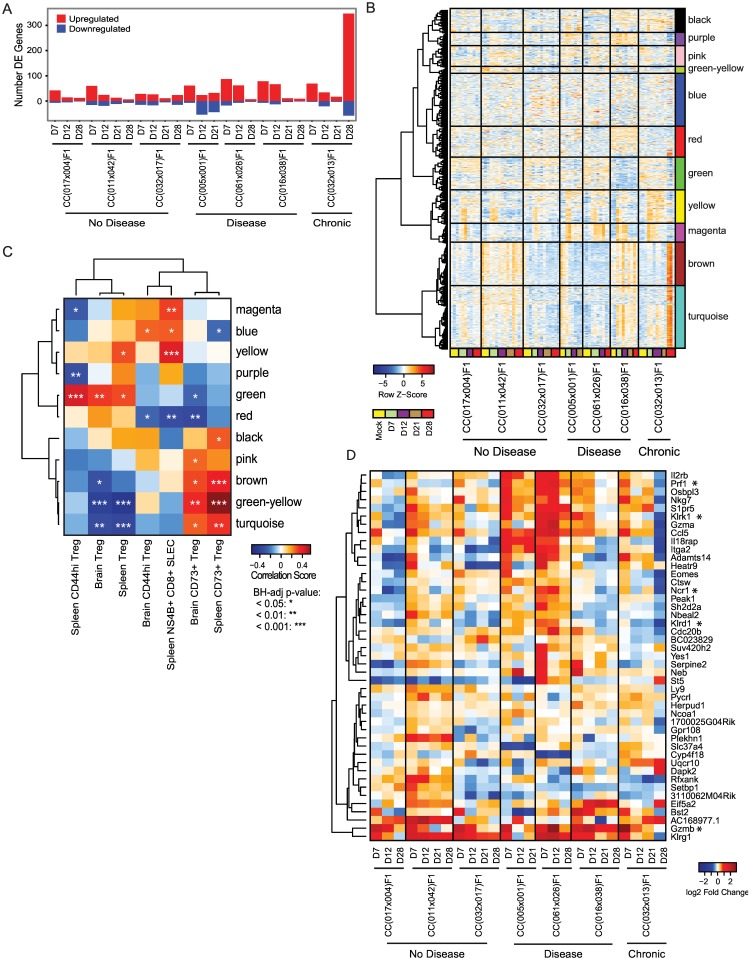
Fig 7. Mouse model of chronic WNV infection reveals that maintenance of cytolytic ability, associated with reduced activation of regulatory T cells, is critical for preventing viral persistence.
(A) Microarry expression analysis of number of differentially expressed (DE) genes upregulated (red) or downregulated (blue) in each RIX across time as compared to mock-infected samples (Fold change > 1.5, BH-adjusted p-value < 0.05). (B) Normalized expression profiles of all genes found to be DE in at least one sample, visualized as relative level across all samples. Each column depicts an individual mouse, with the timepoint designated by a colored bar underneath. Genes were clustered by bicor correlation and divided into modules each labeled by an identifying color and their most highly significant Gene Ontology (GO) Biological Process (BH-adjusted p-value < 0.05). Module processes are color coded: black: GO:0030593 neutrophil chemotaxis, purple: GO:0019835 cytolysis, pink: GO:1990126 retrograde transport, endosome to plasma membrane, green-yellow: GO:0045444 fat cell differentiation, blue: GO:0043401 steroid hormone mediated signaling pathway, red: categories below significance threshold, green: categories below significance threshold, yellow: GO:0034976 response to endoplasmic reticulum stress, magenta: GO:0051607 defense response to virus, brown: GO:0006260 DNA replication, turquoise: GO:0006783 heme biosynthetic process. (C) Correlation map of module eigengenes to key flow cytometric immunophenotypes. Box color represents positive (red) or negative (blue) correlation score. Asterisks denote statistical significance of correlation. (D) Differential expression of genes within the “purple” (cytolosis) module as visualized by log2 fold change over mock-infected samples. Asterisks indicate genes directly involved in cytolytic and NK-killer cell cytotoxicity. Data shown are from three mice per group, for each time point.

