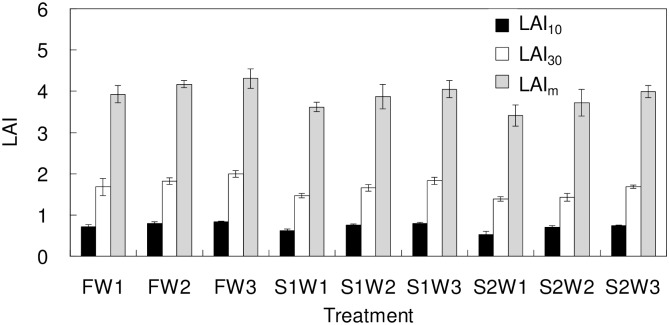
Fig 1. Effects of different treatments on the leaf area index (LAI) (W1, W2 and W3 represent the three irrigation quotas of 280, 320 and 360 mm respectively.
F, S1 and S2 represent the three water salinities of 1.0, 3.0 and 5.0 dS/m. Each value is the mean ± SD (n = 3)). LAI10 and LAI30 represent the LAI at 10 and 30 days after transplant, corresponding to the seedling stage and the flowering stage, respectively. LAIm represent the maximum LAI during the whole growth stage of tomato.

