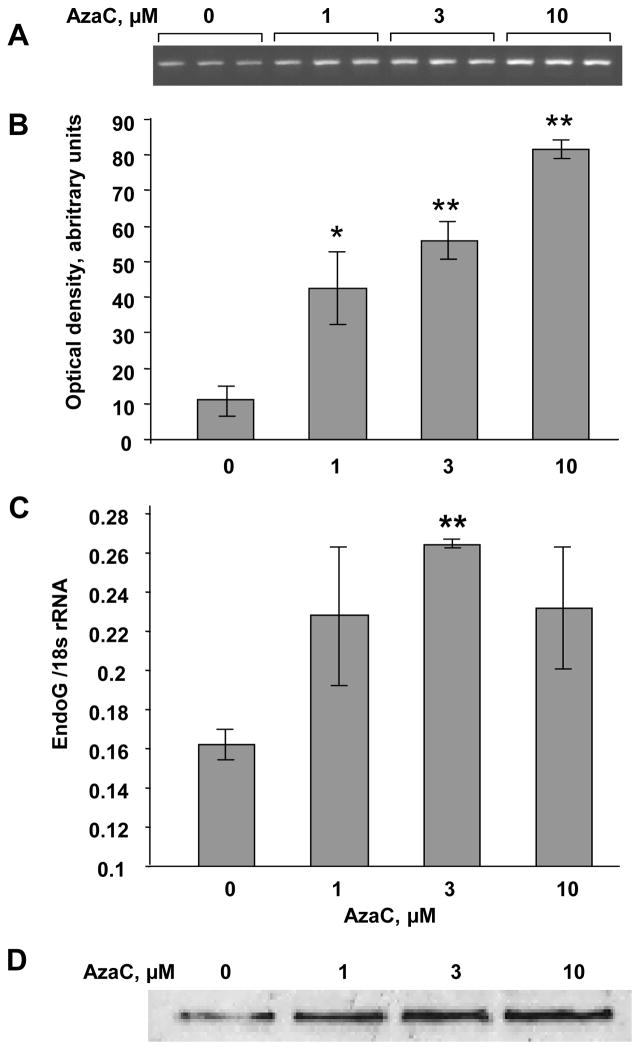
Fig. 6.
Inhibition of DNA methylation induces EndoG expression in PC3 cells. The cells were exposed with AzaC (0–10 μM) for 24 h. (A, B) EndoG promoter methylation was measured using the McrBC-PCR screening method. n = 3 per group, n = 3 per group, * p <0.05, ** p <0.01 compared to zero point. (C) EndoG expression assessed by real-time RT-PCR. n = 4 per group, * p <0.01, (D) EndoG protein expression determined by Western blotting. The membrane was stained with Ponseau S to control equal protein load (75 μg/well).

