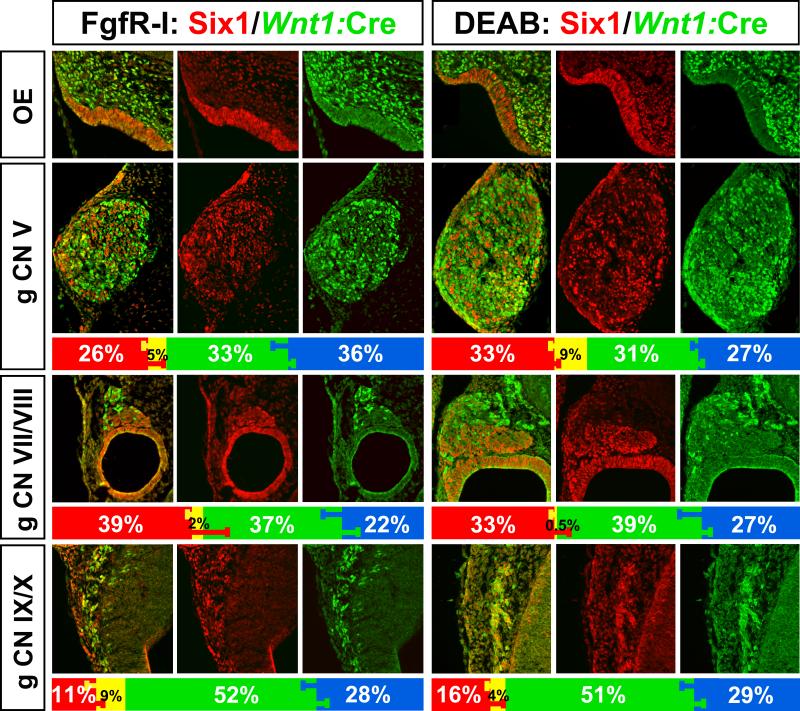
Figure 4.
Consequences of FgfR-I or DEAB treatment at E9.5 for cranial sensory neuron differentiation and frequency of placode (Six1; red) and neural crest (Wnt1:Cre recombined; green) cells. The overall size of the ganglia is diminished by the treatments. The proportions of each cell class, including unlabeled (DAPI cells) are shown in the histograms below each panel. We find no disproportionate statistically significant changes for any cell class compared to the WT distribution (see Figure 2) in response to either FgfR-I or DEAB.

