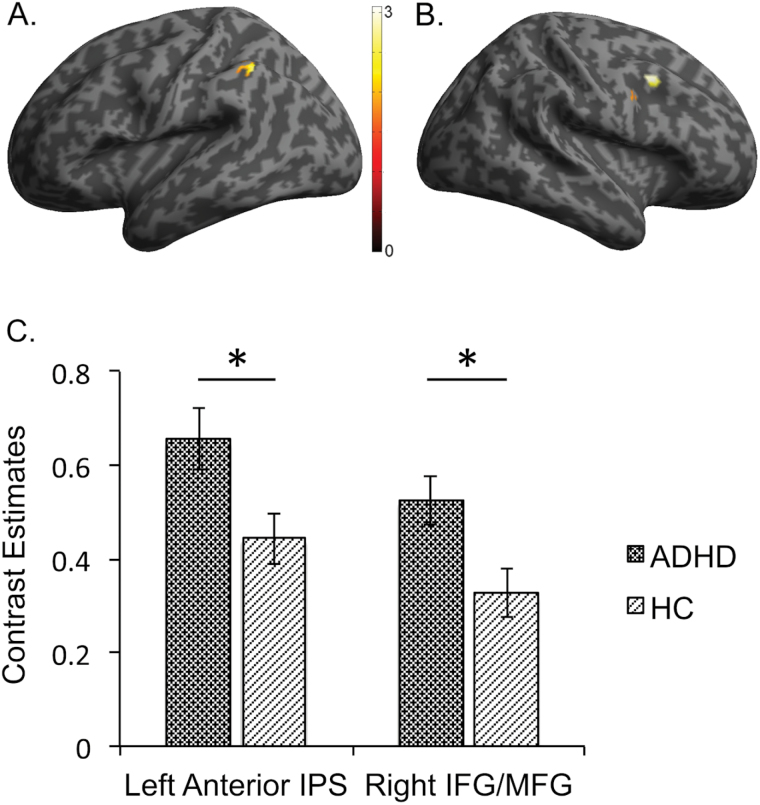
Figure 3.
Clusters found in the ROI analysis that showed significantly greater peak voxel activation for the contrast 2-back minus 0-back in the patient group (ADHD) compared to the healthy control group (HC) in the (A) left anterior intraparietal sulcus (IPS) and in the (B) right inferior/ middle frontal gyrus (IFG/MFG) as well as mean contrast estimates and standard error of measurement for these two clusters (C). *Significantly different, P ≤ .05.

