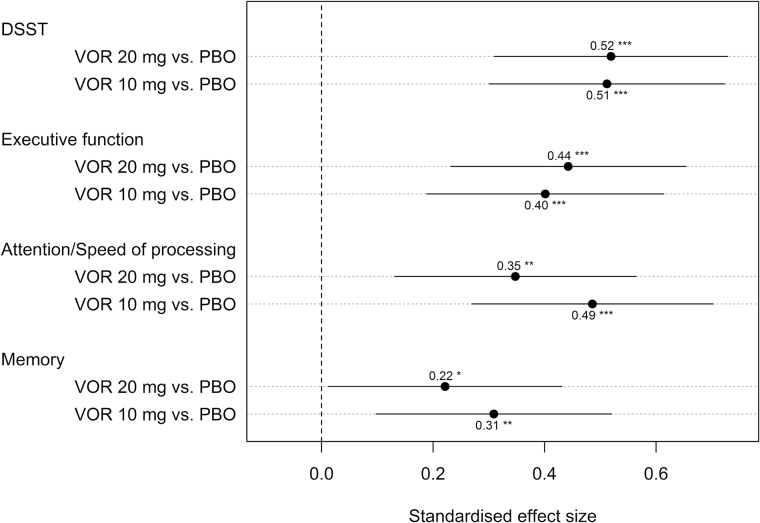
Figure 3.
Forest plot of composite Z-scores at Week 8 for the four cognitive domains. Values are means with the 95% confidence interval for the Mixed Model for Repeated Measurements. * p < 0.05, ** p < 0.01, *** p < 0.001. Executive function: 0.5*standardized Stroop (incongruent) + 0.5*standardized TMT B. Attention/speed of processing: 0.25*standardized Stroop (congruent) + 0.25*standardized TMT A + 0.25*standardized SRT + 0.25*standardized CRT. Memory: 0.5*standardized RAVLT (acquisition) + 0.5*standardized RAVLT (delayed recall). CRT, Choice Reaction Time test; PBO, placebo; RAVLT, Rey Auditory Verbal Learning Test; SRT; Simple Reaction Time test; TMT, Trail Making Test; VOR, vortioxetine.

