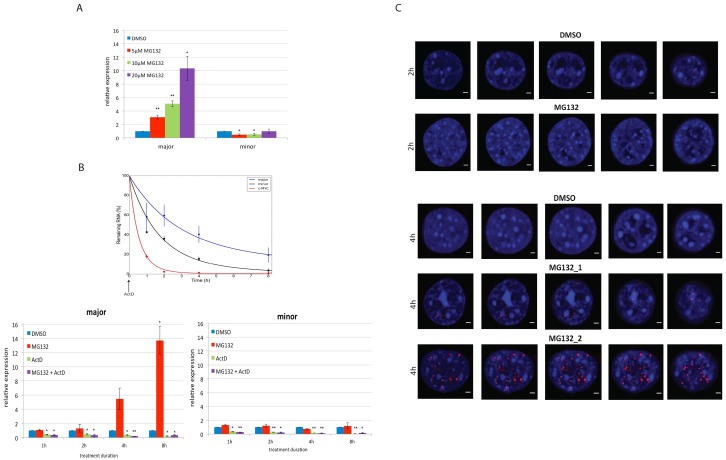
Fig 2. Proteasome inhibition results in upregulation of major satellite repeat expression which is dependent on transcription.
(A) Dose-dependent upregulation of major satellite repeat expression upon proteasome inhibition NIH3T3 cells were treated with 5μM, 10μM and 20μM MG132 for 8h and transcript levels of major satellite and minor satellite were measured by q-RT-PCR. The relative expression was normalised against spiked RNA and shows fold change relative to DMSO (vehicle). Error bars = SEM of 6 biological replicates. (B) Transcription-dependent upregulation of major satellite repeat expression upon proteasome inhibition. Kinetics of the effect of the proteasome inhibition and/or RNAPII inhibition on the expression of major satellite repeats. The right graph indicates the efficiency of the transcriptional inhibition measured by decay of the c-MYC and major transcripts. The exponential decay curve was obtained using best fitted nonlinear regression model. NIH3T3 cells were treated with either 20μM MG132, 20μg/ml ActD or both 20μg/ml ActD and 20μM MG132 for 1h, 2h, 4h and 8h followed by RNA extraction and q-RT-PCR. The relative expression was normalised against spiked RNA or Gapdh and shows fold change relative to DMSO. Error bars = SEM of 3 biological replicates. (C) RNA FISH imaging of major satellite repeat transcription upon proteasome inhibition NIH3T3 cells were treated with 20μM M132 for 2h and 4h followed by RNA-FISH analysis using major satellite probe. Representative mid-zone confocal z-sections images for DAPI (blue), major (red) and merge are shown for 2h and 4h with DMSO and MG132 treatment. Scale bar 2μm. * p<0.05, ** p<0.001 (Student’s ‘t’ test).

