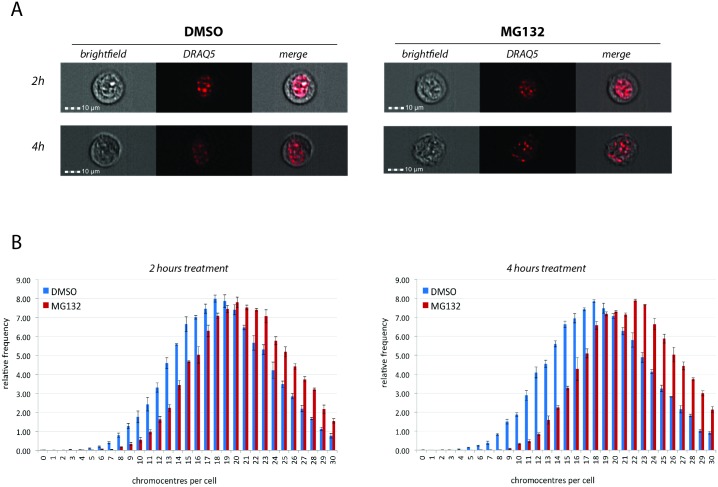
Fig 5. Proteasome inhibition increases the number of chromocentres per cell.
NIH3T3 cells were treated with DMSO (vehicle) or 20μM MG132 for 2h and 4h followed by DRAQ5 staining and imaging using ImageStreamX. (A) Representative images from brightfield and DRAQ5 wavelengths for each time point of the treatment. DRAQ5 identified chromocentres. (B) Comparison of the distribution of the number of chromocentres per cell upon treatment with MG132 and DMSO for each time point (Chi-squared P<0.0001 at both 2 and 4h). Error bars = SEM of 3 biological replicates.

