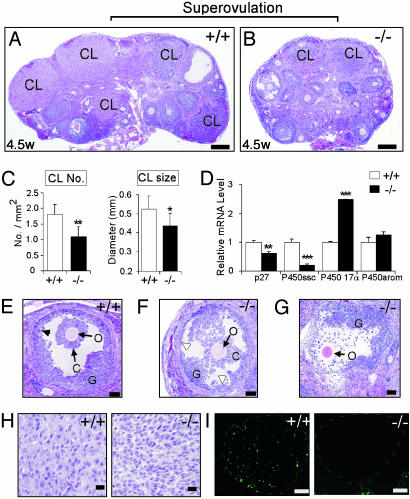
Fig. 3.
Comparison of morphology and gene expression in ovaries of AR+/+ and AR–/– females after superovulation treatment. Animals were injected with PMSG and then with hCG 48 h later and were killed after another 22 h. (A and B) Superovulated ovaries from 4.5-week-old AR+/+ and AR–/– females (n = 5 for each genotype) were compared. Many CLs were induced by superovulation in the AR+/+ ovaries, compared with fewer and smaller CLs in the AR–/– ovaries. (C) Statistical analysis of the number and size of CLs in both genotypes. *, P < 0.05; **, P < 0.01. (D) Real-time RT-PCR analysis of the expression levels of the functional markers for luteinization. Statistical significance determined by using Student's unpaired and two-tailed t test is indicated. **, P < 0.01; ***, P < 0.001. (E and F) Histological comparison at high magnification. In the AR–/– ovaries, the large antral follicles show decreased and disorganized granulosa cells, although the oocyte showed no sign of apoptosis. The granulosa layers were locally thin (open arrowhead) in the AR–/– ovaries, whereas they were even in thickness in the AR+/+ ovaries (arrowhead). (G) The cumulus cells were disassociated from the oocyte during ovulation in the AR–/– ovaries. The possibility that this phenomenon may also occur in the AR+/+ ovaries needs to be further investigated. O, oocyte; C, cumulus oophorus; G, granulosa cells. (H) The AR+/+ CLs contain large lutea cells, whereas the AR–/– CLs contain early, small luteal cells, indicating delayed or impaired granulosa luteinization. (I) AR+/+, but not AR–/–, CLs (white dashed circles) show luteolysis (apoptosis) when TUNEL staining is used. Representative sections are shown. (Bars: A and B, 200 μm; E–G, 50 μm; H, 20 μm; I, 100 μm.)

