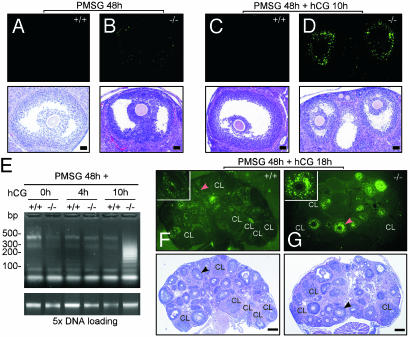
Fig. 4.
Detection of apoptotic cells in the ovaries of AR+/+ and AR–/– females treasted with exogenous gonadotropins by using TUNEL assay. The treatment conditions are as indicated. (A and B) Preovulatory follicles from both genotypes were compared. The AR–/– preovulatory follicle (B) shows slight apoptotic signals, whereas the AR+/+ preovulatory follicle (A) shows no apoptosis. Note that after TUNEL staining and photographing (Upper), the sections were subjected to hematoxylin and eosin staining (Lower). (C and D) Preovulatory follicles during the periovulatory stage from both genotypes were compared. The AR–/– preovulatory follicle (D) shows intensive granulosa apoptosis and reduced size, whereas the AR+/+ counterpart (C) shows no apoptosis. (E) The DNA fragmentation assay using ligation-mediated PCR. DNA ladders were amplified from 50 ng of genomic DNAs (Upper). At Lower, 250 ng of genomic DNAs (5×) is shown as loading control. (F and G) Superovulated ovaries from AR+/+ and AR–/– females were compared. In the AR+/+ ovaries, apoptotic granulosa cells were scattered in many follicles but not in CLs, whereas intensive granulosa apoptosis was seen in many preantral and antral follicles in the AR–/– ovaries. The Inset shows high magnification of the indicated follicles (arrowheads). Apoptotic signals are shown in bright green. Representative sections are shown. (Bar: A–D, 50 μm; F and G, 200 μm.)

