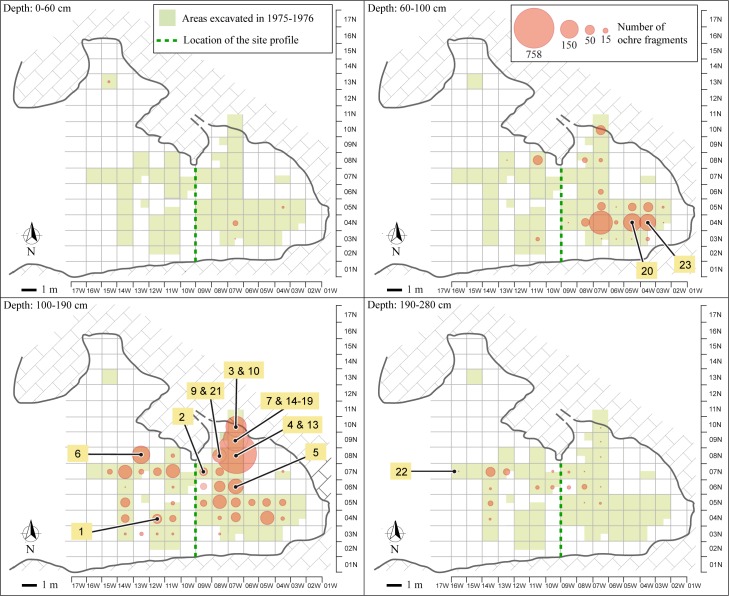
Fig 4. Spatial distribution of ochre fragments, ochre processing tools and ochre-stained artefacts.
Bubble sizes reflect the frequency of ochre fragments per grid unit. Numbers refer to ochre processing tools and ochre-stained artefacts. The objects' identification number is the same as presented in Figs 5–11, Tables 1–5, S1 and S2 Figs, S1 Table, S1 Text. This figure is similar but not identical to the image from [37], and is therefore for illustrative purposes only.

