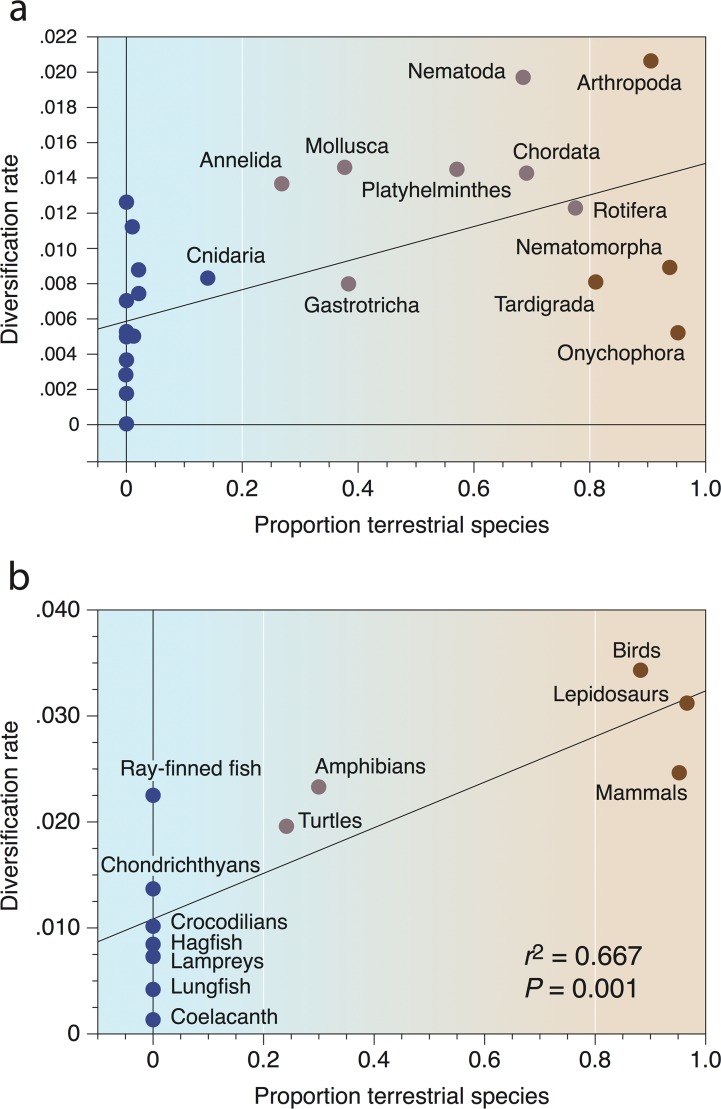
Fig 2. Relationship between habitat (proportion of terrestrial species) and net diversification rates.
Data are shown for animals (a) and vertebrates (b). Predominantly marine forms are highlighted blue, and predominantly terrestrial forms, brown. Based on data in [23] and [24], respectively; drafted by Simon Powell (University of Bristol).

