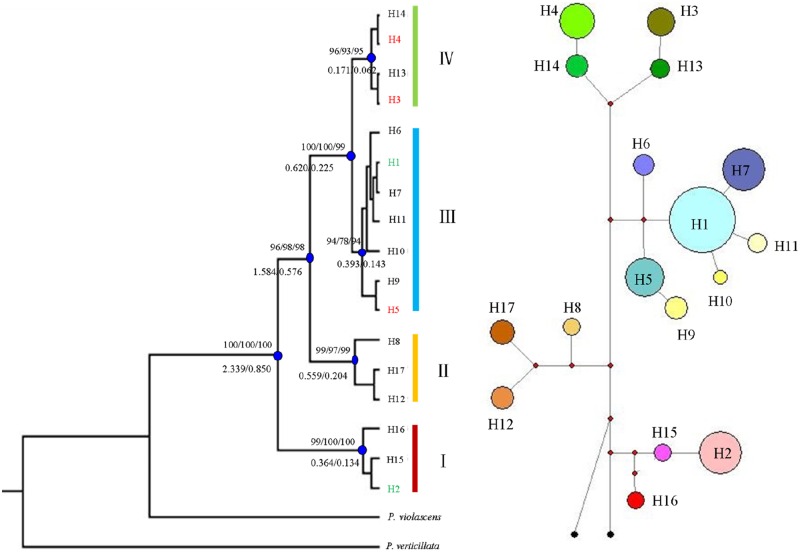
Fig 3. The NJ tree topology (left) and network (right) of the 17 cpDNA haplotypes detected in Pedicularis kansuensis and their divergence times estimated with the average evolutionary rate based on BEAST analysis.
The values above the branch represent the bootstrap values for NJ (left), MP (middle) and ML (right) analyses, respectively. The values under the branching represent the divergence time (in million years ago), based on 3.0×10⁻⁹ substitutions per site per year [s/s/y] and 8.24×10⁻⁹ s/s/y. The circle sizes in the network are proportional to haplotype frequency, and the black points represent outgroups.

