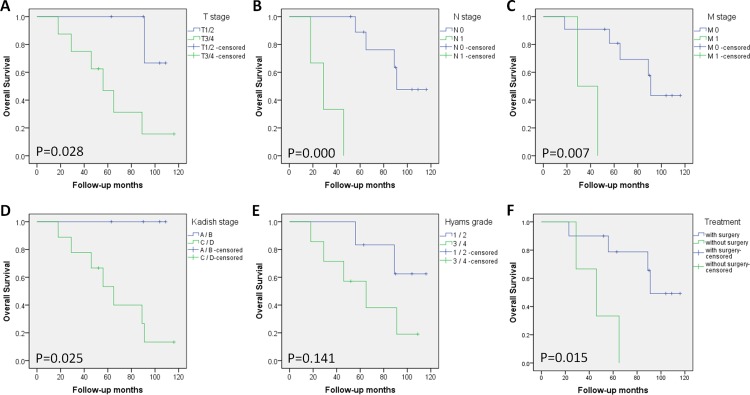
Fig 4. Kaplan-Meier survival analysis of the overall survival, using Log-rank test.
Survival curves were plotted based on potential prognostic factors respectively, which were T stage (A), N stage (B), M stage (C), modified Kadish stage (D), Hyams grade (E) and treatment modality (F). P values were as shown in each figure.

