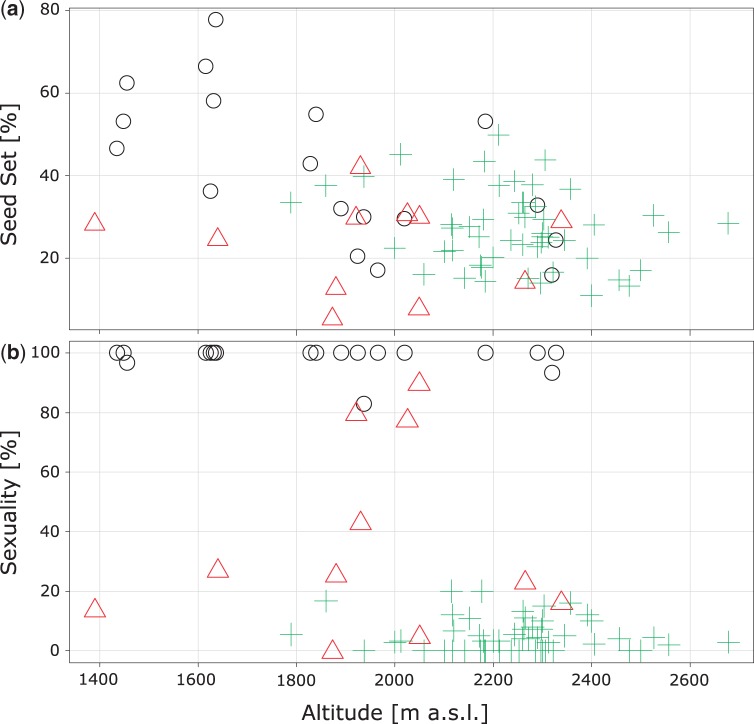
Figure 3.
Scatterplots showing variation between Ranunculus kuepferi cytotypes on population level regarding reproduction parameters in dependence of elevation. Black circle (o): diploid populations; green cross ( ): tetraploid populations; red triangle (
 ): population consisting of individuals with different cytotypes (mixed). (a–b) Proportions of well-developed achenes per flower and plant (seed set, a), as well as proportions of facultative sexuality contributing to seed development (b) in dependence of elevation above sea level (elevation).

