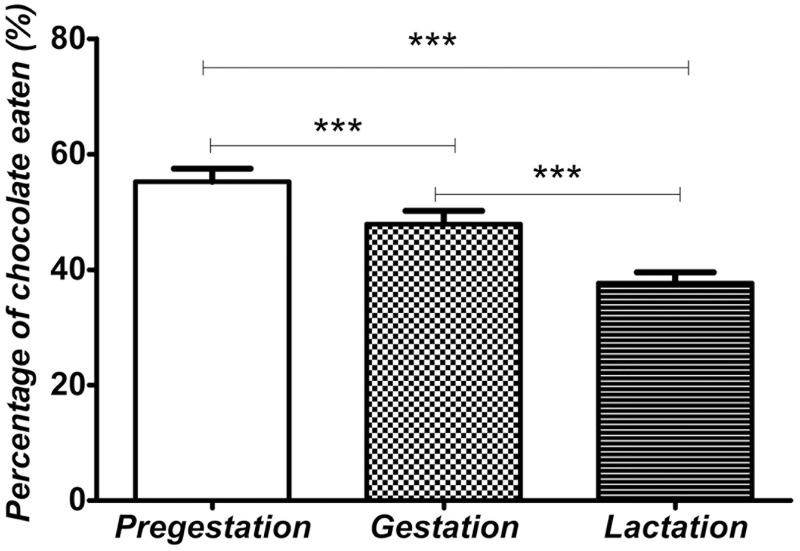
Fig 2. Chocolate preference in rat dams assigned to free choice diet.
The bars indicate the average of chocolate preference during every perinatal period (pregestation, gestation and lactation). Values are expressed as means ± S.E.M. Statistical analysis was performed by one-way ANOVA of repeated measures. Bonferroni multiple comparisons indicated significantly differences between groups: *** p<0.001.

