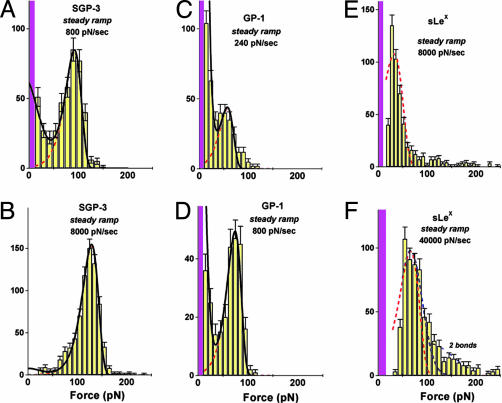
Fig. 4.
Force histograms obtained from steady ramp tests of SGP-3–P-selectin bonds (A and B), GP-1–P-selectin bonds (C and D), and b-sLeX–P-selectin bonds (E and F). Superposed in A–D are the probability distributions computed for the two-pathway switch (solid dark curves) as well as the kinetically limited pathway distributions (dashed red curves). (A and B) Match of the two-pathway model to the data for SGP-3–P-selectin bonds gave parameters similar to those obtained for PSGL-1–P-selectin bonds (see Fig. 6): i.e., a rate of k1rup ≈ 7–13/sec for dissociation along the first pathway and switch to the second pathway above ≈20–30 pN defined by the failure rate, k2rup ≈ (0.2 ± 0.1/sec) exp(f/16 ± 0.5 pN). (C and D) Optimal match to the data for GP-1–P-selectin bonds yielded a rate of k1rup ≈ 50 ± 10/sec along pathway 1, followed by a switch to pathway 2 above ≈20 pN defined by the rate k2rup ≈ (0.3 ± 0.1/sec) exp(f/14 ± 0.5 pN). (E and F) Superimposed (dotted red curve) on the data for b-sLeX–P-selectin bonds are probability densities for a single kinetically limited pathway defined by the failure rate krup ≈ (90 ± 10/sec) exp(f/20 ± 1 pN). Also shown in E is the broadening (dotted blue curve) expected from error (σexp ≈± 10–11 pN) in force detection with the large BFP stiffness needed for ultrafast loading. Similarly, a gap appears between the magenta bin and the lowest forces detected because of the limitation by video framing rate (≈1,500/sec) at very fast pulling speeds. [Again, a few (<20% in all cases) double bonds seem to account for the tails of very high forces, as shown by the predicted distribution added to the histogram in F.]

