Fig. 1.
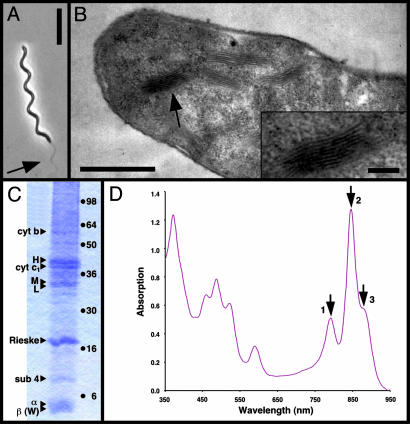
Isolation of native membranes from Rsp. photometricum.(A) Phase contrast light microscopy image of Rsp. photometricum. Arrow points at the flagella. (Bar = 10 μm.) (B) Thin section transmission electron microscopy image of Rsp. photometricum. Arrow points at the stacked chromatophore membranes. (Bar = 1 μm.) (Inset) Stack of intracytoplasmic membranes (Bar = 200 nm.) (C) SDS/PAGE analysis of membrane components. Membranes were solubilized and separated on a 12% acrylamide gel before staining with Coomassie blue. Triangles on the left of the gel lane indicate attributions of bands based on molecular weight, haem staining, and partial purification of complexes; points on the right indicate the migration of standard proteins (SeeBlue, Invitrogen). (D) Absorption spectrum of isolated membranes. The three arrows indicate the near-infrared absorption maxima associated with bacteriochlorophyll Qy transitions of the LH2 at 791 nm (1) and 846 nm (2) and LH1 at 882 nm (3). Based on approximate extinction coefficients, the observed absorption spectrum corresponds to about seven LH2 complexes per core complex.

