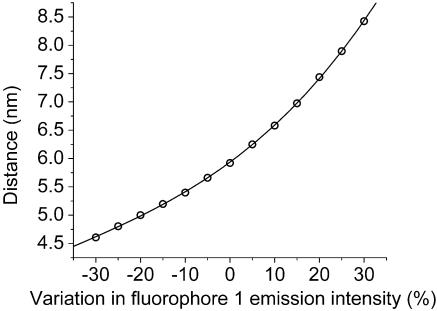
Fig. 5.
Deviation of localized centroid value of fluorophore 2 due to variation in the intensity of fluorophore 1. The data were calculated as follows: taking N001 as the peak intensity of fluorophore 1 determined by centroid localization from the one-dye image, the data point at 5% variation was obtained by subtracting the contribution of fluorophore 1 with N001′ = 1.05 N001 from the two-dye image. Then, the centroid of fluorophore 2 was localized, and the distance between the two centroids was calculated. The data point at –5% variation was calculated by taking N001′ = 0.95 N001. All other data points were obtained in the same way. The dots are the data from the simulation and the curve is a power law fit to the data. The best cubic polynomial fitis Y = 5.936 + 5.83 × 10⁻²X + 6.6 × 10–4X2 + 5.8 × 10–6X3 nm.

