Fig. 2.
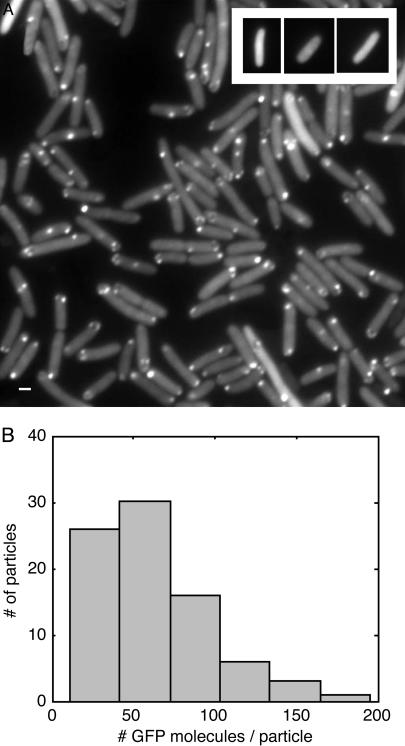
GFP-tagged RNA molecules in E. coli cells. (A) Cells carrying BAC2 plus the 96 BS coding sequence and K133 plus MS2d–GFP were grown in LB at 37°C to an OD600 of ≈0.3–0.5. aTc (10 ng/ml) and IPTG (1 mM) were added. After 45–60 min, a few microliters of culture was placed between a coverslip and a thin slab of 0.8% agarose with LB. Cells were observed under epifluorescence, and images were taken at a 100-ms exposure time. As shown in Movies 1 and 2, most spots fluctuate around their mean location. The motion is not inhibited by the addition of 0.2% sodium azide (an inhibitor of ATPase) under conditions where cell growth is completely inhibited in 10 min, suggesting that the motion is passive rather than active. (Scale bar = 1 μm.) (Inset) Absence of spots in cells carrying K133 plus MS2d–GFP and BAC2 without the 96 BS coding sequence. Cells were grown and induced as in A. Cells exhibited low uniform fluorescence of varying levels. (B) Estimation of the number of GFP molecules in each fluorescent particle. Eighty spots were quantified: the histogram of N is shown, where N = (f_spot – f_cell)/(f_GFP). f denotes total photon flux per sec. Fluxes measured were from individual fluorescent spots in the cell (f_spot), background fluorescence in the same cell (f_cell), and individual MS2d–GFP molecules (30 measurements; see supporting information) (f_gfp). Exposure times were 250 msec for cell images and 2.5 sec for single molecules, under identical microscopy conditions. From the histogram we can estimate that each spot corresponds to 20–100 MS2d–GFP molecules (≈70 on average), consistent with our hypothesis that they correspond to single RNA molecules tagged by MS2d–GFP.

