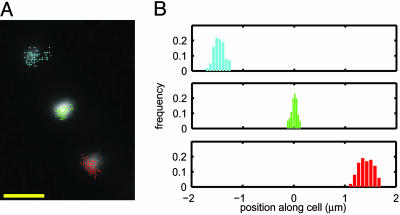
Fig. 3.
Localized motion of multiple RNA particles in a cell. (A) The measured locations of three individual spots, superimposed on an epifluorescence image of the cell. (Scale bar = 1 μm.) (B) Histograms of spot positions along the cell. Position along the cell was obtained by projecting the spot location (x,y) on the long axis of the cell (xl): xl = x cos θ + y sin θ, where θ is the angle between the long axis of the cell and x axis. Each spot is localized in a small region of the cell, with a bell-shaped distribution of positions. Cells were grown and induced as in Fig. 2. A single cell was tracked for 10 min (one frame per 2 sec, with an exposure time of 250 msec; see Movie 3).

