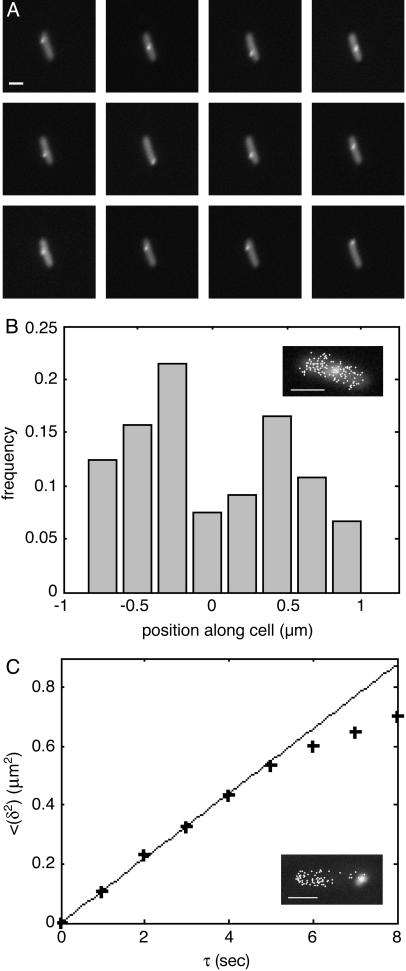
Fig. 4.
Two cells exhibiting motion of an RNA particle over the entire cell. Cells were grown and induced as in Fig. 2. (A and B) Cell 1 was tracked for >1h, at one frame per 30 sec (exposure time of 50 msec; see Movie 4). (Scale bars = 1 μm.) (A) A series of epifluorescent images of the cell. Images are 30 sec apart. During the 6 min covered, the RNA particle traveled the length of the cell twice. (B) Histogram of particle position along the cell. Position along the cell was obtained by projecting the spot location (x, y) on the long axis of the cell (see Fig. 3). The spot traversed the entire length of the cell, but the distribution of positions was not uniform. Rather, the particle spent more time away from the center of the cell, closer to the poles (see text). (Inset) Epifluorescence image of the cell, superimposed by measured locations of the RNA spot. (C) Cell 2 was tracked for 2 min, at one frame per sec, with an exposure time of 500 msec (see Movie 5). Mean displacement squared (see text), as a function-of-time interval between measurements. + indicates measurements; solid line indicates linear fit. The linear behavior up to τ ≈ 5 sec suggests that the motion is diffusive. (Inset) Epifluorescence image of the cell, superimposed by measured locations of the RNA spot.

