. 2016 Oct 12;5:e19532. doi: 10.7554/eLife.19532

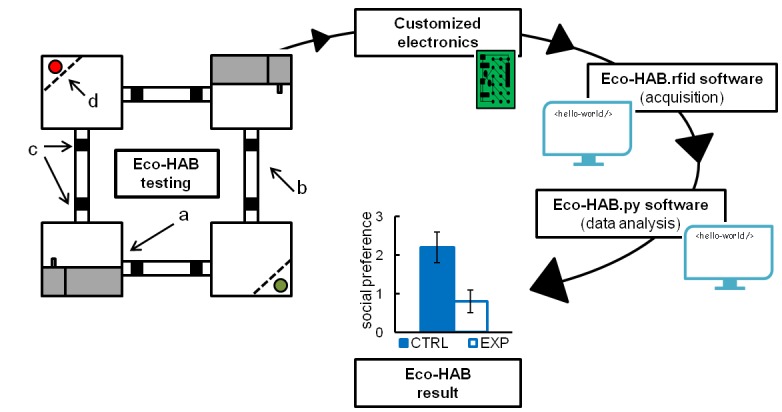
Figure 1. A schematic representation of Eco-HAB system and data processing.

Eco-HAB consists of four housing compartments (a), tube-shaped inter-territorial passages (b), radio-frequency identification antennas (c), and impassable, perforated partitions behind which social and non-social (control) provenance stimuli may be presented (d, red/green dots). Food and water is available in housing compartments adjacent to those containing partitions. Eco-HAB is equipped with customized electronics and two software packages: Eco-HAB.rfid (for data acquisition and collection) and Eco-HAB.py (for filtering corrupted data segments and performing tailored analysis). For a detailed system and software description, see 'Materials and methods'.
DOI: http://dx.doi.org/10.7554/eLife.19532.002

Figure 1.

Figure 1—figure supplement 1. Block schematic diagram of customized electronic system for Eco-HAB.
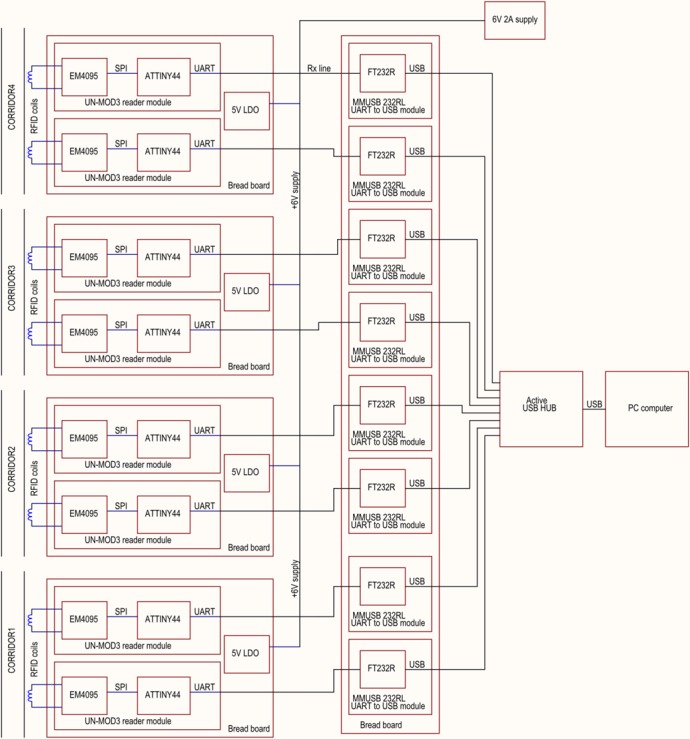
Figure 1—figure supplement 1.

Figure 1—figure supplement 2. RFID antenna efficiency compared to video-based manual scoring.
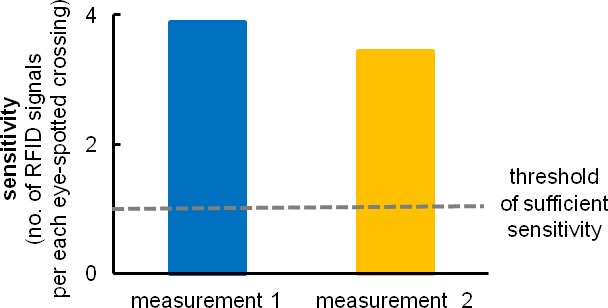
Figure 1—figure supplement 2.

We counted the number of RFID registrations per visually registered crossing under the antenna. The implemented system of coils recognizes subjects at a rate of at least one or more RFID registration per one video-recorded passing, a rate better than needed to record all events. Superfluous RFID readouts are later eliminated by Eco-HAB.py software that contains algorithms recognizing such events (see 'Materials and methods'). Due to the built-in internal synchronization system, RFID antennas run independently and do not disrupt one another. All eight coils may be activated simultaneously for unlimited time, which leads to highly effective animal recognition (less than 0.6% unidentified animals’ positions).
Figure 1—figure supplement 3. Comparison of time (person-hours) needed for Eco-HAB testing versus three-chambered apparatus testing (stress reducing conditions) of a group of 12 mice.
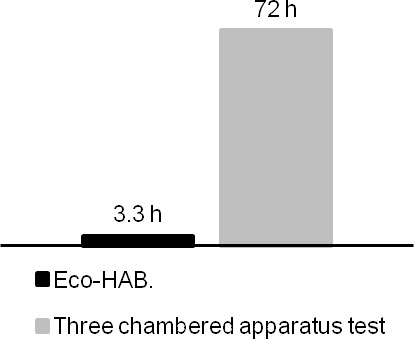
Figure 1—figure supplement 3.

For detailed description of behavioral protocols see 'Materials and methods'.
Figure 1—figure supplement 4. Eco-HAB measures in-cohort sociability in mice.
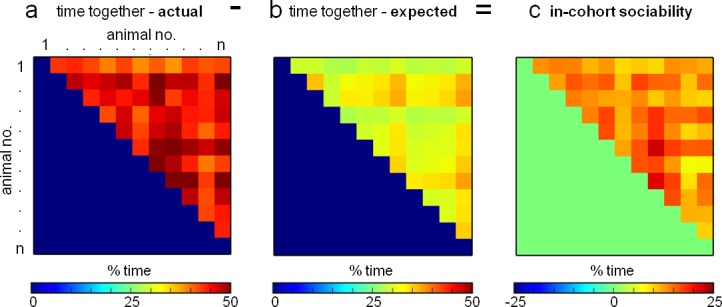
Figure 1—figure supplement 4.

(a) Detailed data regarding quantity of time spent by each mouse with every other animal in the group can be obtained in Eco-HAB. (b) Based on simultaneous territory occupation for each individual, we calculate the minimum time each given pair of subjects must spend together. (c) After subtracting expected time together from the acquired one, we obtained amount of time animals willfully spent together, as it cannot be attributed to the dispersal pattern within the system.
Figure 1—figure supplement 5. Eco-HAB allows for a detailed analysis of subjects' preference to spend time with another mouse from a tested cohort.
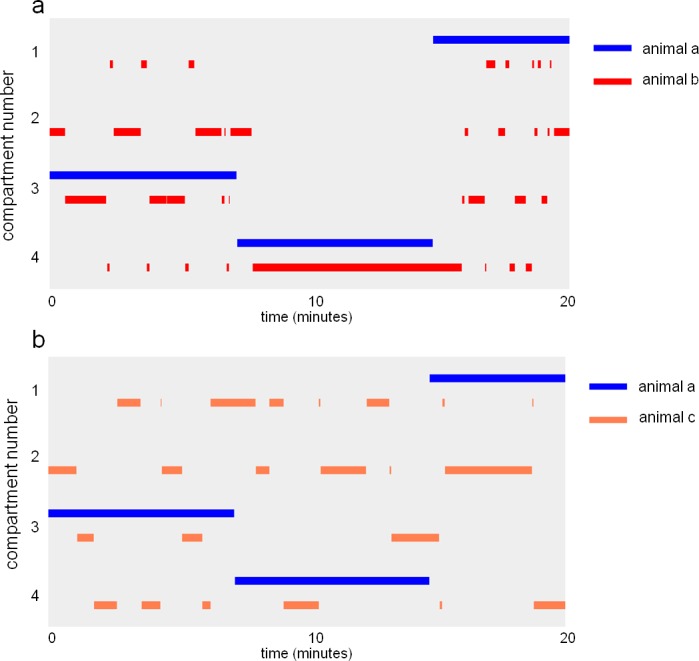
Figure 1—figure supplement 5.

Examples show (a) a pair of mice spending most of their time together, regardless of their position within the territory, and (b) a pair of mice spending time mostly in different areas of Eco-HAB. Bars represent presence of a mouse in one of four Eco-HAB compartments (numbered 1–4).
Figure 1—figure supplement 6. Monitoring of subjects’ dispersal within Eco-HAB territory for exemplary cohorts of (a) C57BL/6 and (b) BALB/c mice.
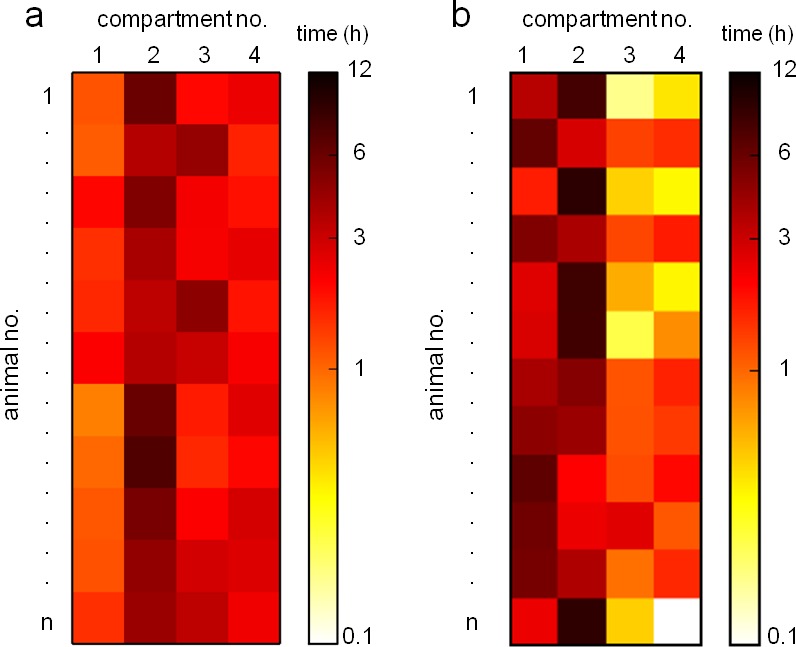
Figure 1—figure supplement 6.

Customized software provides easy access to data on the amount of time spent by a mouse in each Eco-HAB compartment. An example here shows mouse activity distribution in 12-hr dark phase during the adaptation stage.