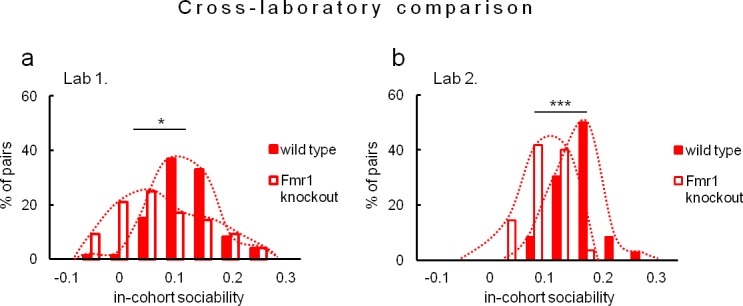
Figure 7. Evaluation of in-cohort sociability in Fmr1 knockouts and wild-type littermate controls undertaken in two different laboratories.

(a, Fmr1 knockout n = 22, wild-type control n = 18) vs. (b, Fmr1 knockout n = 11, wild-type control n = 9) – gives corresponding results. A histogram illustrating score of Fmr1 knockouts is shifted to the left as compared to that for wild-type control, signifying less time voluntarily spent together with other subjects within a tested cohort.
DOI: http://dx.doi.org/10.7554/eLife.19532.028
